An Introduction to Hypothesis Testing
Introduction:
Many problems require that we decide whether to accept or reject some parameter. The statement is usually called a Hypothesis and the decision-making process about the hypothesis is called Hypothesis Testing. This is one of the most useful concepts of Statistical Inference since many types of decision problems can be formulated as hypothesis testing problems.
If an engineer has to decide based on sample data whether the true average lifetime of a certain kind of tire is at least 42,000 miles, or if an agronomist has to decide based on experiments whether one kind of fertilizer produces a higher yield of soybeans than another, and if a manufacturer of pharmaceutical products has to decide based on samples whether 90 percent of all patients given a new medication will recover from a certain disease or not, all of these problems can be translated into the language of statistical tests of hypotheses.
In the first case, we might say that the engineer has to test the hypothesis that θ, the parameter of an exponential population, is at least 42,000 while in the second case we might say that the agronomist has to decide whether μ1>μ2, where μ1 and μ2 are the means of two normal populations and in the third case we might say that the manufacturer has to decide whether θ, the parameter of a binomial population, equals 0.90. In each case it must be assumed, of course, that the chosen distribution correctly describes the experimental conditions; that is, the distribution provides the correct statistical model.
KEY TAKEAWAYS
- Hypothesis testing is used to assess the plausibility of a hypothesis by using sample data.
- The test provides evidence concerning the plausibility of the hypothesis, given the data.
- Statistical analysts test a hypothesis by measuring and examining a random sample of the population being analyzed.
- The four steps of hypothesis testing include stating the hypotheses, formulating an analysis plan, analyzing the sample data, and analyzing the result.
This article was published as a part of the Data Science Blogathon.
What is Hypothesis Testing?
Hypothesis testing is a statistical method that is used to make a statistical decision using experimental data. Hypothesis testing is basically an assumption that we make about a population parameter. It evaluates two mutually exclusive statements about a population to determine which statement is best supported by the sample data.
How Hypothesis Testing Works
In hypothesis testing, an analyst tests a statistical sample, intending to provide evidence on the plausibility of the null hypothesis. Statistical analysts measure and examine a random sample of the population being analyzed. All analysts use a random population sample to test two different hypotheses: the null hypothesis and the alternative hypothesis.
The null hypothesis is usually a hypothesis of equality between population parameters; e.g., a null hypothesis may state that the population mean return is equal to zero. The alternative hypothesis is effectively the opposite of a null hypothesis. Thus, they are mutually exclusive, and only one can be true. However, one of the two hypotheses will always be true.
Suppose we want to show that one kind of ore has a higher percentage content of uranium than another kind of ore, we might formulate the hypothesis that the two percentages are the same; and if we want to show that there is greater variability in the quality of one product than there is in the quality of another, we might formulate the hypothesis that there is no difference; that is, σ1 = σ2. Given the assumptions of “no difference,” hypotheses such as these led to the term null hypothesis. Symbolically, we shall use the symbol H0 for the null hypothesis that we want to test and H1 or Ha for the alternative hypothesis.
Four Step Process
- State the hypotheses.
- Formulate an analysis plan, which outlines how the data will be evaluated.
- Carry out the plan and analyze the sample data.
- Analyze the results and either reject the null hypothesis, or state that the null hypothesis is plausible, given the data.
Example of Hypothesis Testing
If an individual wants to test that a penny has exactly a 50% chance of landing on heads, the null hypothesis would be that 50% is correct, and the alternative hypothesis would be that 50% is not correct. Mathematically, the null hypothesis is represented as Ho: P = 0.5. The alternative hypothesis is shown as “Ha” and is identical to the null hypothesis, except with the equal sign struck-through, meaning that it does not equal 50%.
A random sample of 100 coin flips is taken, and the null hypothesis is tested. If it is found that the 100 coin flips were distributed as 40 heads and 60 tails, the analyst would assume that a penny does not have a 50% chance of landing on heads and would reject the null hypothesis and accept the alternative hypothesis.
If there were 48 heads and 52 tails, then it is plausible that the coin could be fair and still produce such a result. In cases such as this where the null hypothesis is “accepted,” the analyst states that the difference between the expected results (50 heads and 50 tails) and the observed results (48 heads and 52 tails) is “explainable by chance alone.”
When Did Hypothesis Testing Begin?
Some statisticians attribute the first hypothesis tests to satirical writer John Arbuthnot in 1710, who studied male and female births in England after observing that in nearly every year, male births exceeded female births by a slight proportion. Arbuthnot calculated that the probability of this happening by chance was small, and therefore it was due to “divine providence.”
What are the Benefits of Hypothesis Testing?
Hypothesis testing helps assess the accuracy of new ideas or theories by testing them against data. This allows researchers to determine whether the evidence supports their hypothesis, helping to avoid false claims and conclusions. Hypothesis testing also provides a framework for decision-making based on data rather than personal opinions or biases. By relying on statistical analysis, hypothesis testing helps to reduce the effects of chance and confounding variables, providing a robust framework for making informed conclusions.
What are the Limitations of Hypothesis Testing?
Hypothesis testing relies exclusively on data and doesn’t provide a comprehensive understanding of the subject being studied. Additionally, the accuracy of the results depends on the quality of the available data and the statistical methods used. Inaccurate data or inappropriate hypothesis formulation may lead to incorrect conclusions or failed tests. Hypothesis testing can also lead to errors, such as analysts either accepting or rejecting a null hypothesis when they shouldn’t have. These errors may result in false conclusions or missed opportunities to identify significant patterns or relationships in the data
2. P – values
What is the P-value?
The p-value, or probability value, is a statistical measure used in hypothesis testing to assess the strength of evidence against a null hypothesis. It represents the probability of obtaining results as extreme as, or more extreme than, the observed results under the assumption that the null hypothesis is true.
How P-value is calculated?
Calculating the p-value typically involves the following steps:
- Formulate the Null Hypothesis (H0): Clearly state the null hypothesis, which typically states that there is no significant relationship or effect between the variables.
- Choose an Alternative Hypothesis (H1): Define the alternative hypothesis, which proposes the existence of a significant relationship or effect between the variables.
- Determine the Test Statistic: Calculate the test statistic, which is a measure of the discrepancy between the observed data and the expected values under the null hypothesis. The choice of test statistic depends on the type of data and the specific research question.
- Identify the Distribution of the Test Statistic: Determine the appropriate sampling distribution for the test statistic under the null hypothesis. This distribution represents the expected values of the test statistic if the null hypothesis is true.
- Calculate the Critical-value: Based on the observed test statistic and the sampling distribution, find the probability of obtaining the observed test statistic or a more extreme one, assuming the null hypothesis is true.
othesis and set our significance level ∝ before we collect or see any data which we choose depends on the consequences of various errors.
P-value in Hypothesis testing
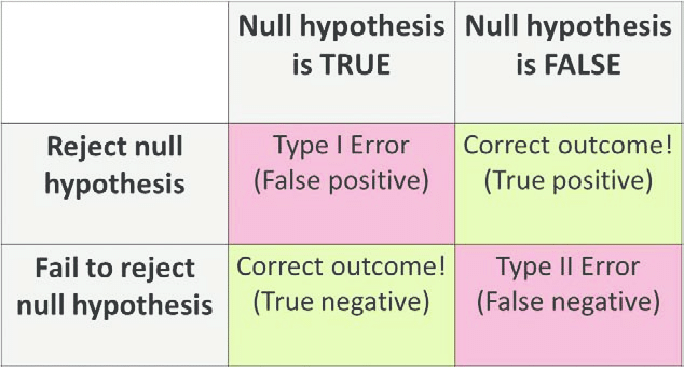
The table given below shows the importance of p-value and shows the various kinds of errors that occur during hypothesis testing.
| Truth /Decision | Accept h0 | Reject h0 |
| h0 -> true | Correct decision based on the given p-value (1-α) | Type I error (α) |
| h0 -> false | Type II error (β) | Incorrect decision based on the given p-value (1-β) |
Type I error: Incorrect rejection of the null hypothesis. It is denoted by α (significance level).
Type II error: Incorrect acceptance of the null hypothesis. It is denoted by β (power level)
How to interpret p-value?
To interpret the p-value, you need to compare it to a chosen significance level.During hypothesis testing, we assume a significance level (α), generally 5% (α = 0.05). It is the probability of rejecting the null hypothesis when it is true. It is observed that lower the p-value, higher is the probability of rejecting the null hypothesis. When:
- p ≤ (α = 0.05) : Reject the null hypothesis. There is sufficient evidence to conclude that the observed effect or relationship is statistically significant, meaning it is unlikely to have occurred by chance alone.
- p > (α = 0.05) : reject alternate hypothesis (or accept null hypothesis). The observed effect or relationship does not provide enough evidence to reject the null hypothesis. This does not necessarily mean there is no effect; it simply means the sample data does not provide strong enough evidence to rule out the possibility that the effect is due to chance.
In case the significance level is not specified, consider the below general inferences while interpreting your results.
- If p > .10: not significant
- If p ≤ .10: slightly significant
- If p ≤ .05: significant
- If p ≤ .001: highly significant
Graphically, the p-value is located at the tails of any confidence interval.

Significance of P-value
- The p-value provides a quantitative measure of the strength of the evidence against the null hypothesis.
- Decision-Making in Hypothesis Testing
- P-value serves as a guide for interpreting the results of a statistical test. A small p-value suggests that the observed effect or relationship is statistically significant, but it does not necessarily mean that it is practically or clinically meaningful.
Applications of p-value
- During Forward and Backward propagation: When fitting a model (say a Multiple Linear Regression model), we use the p-value in order to find the most significant variables that contribute significantly in predicting the output.
- Effects of various drug medicines: It is highly used in the field of medical research in determining whether the constituents of any drug will have the desired effect on humans or not. P-value is a very strong statistical tool used in hypothesis testing. It provides a plethora of valuable information while making an important decision like making a business intelligence inference or determining whether a drug should be used on humans or not, etc. For any doubt/query, comment below.
3. Type I and Type II Errors :
The Probability of getting a type I error is the significance level because if our null hypothesis is true, let’s say that our significance level is 5%. Well, 5% of the time, even if our null hypothesis is true, we are going to get a statistic that’s going to make you reject the null hypothesis. So, one way to think about the probability of a Type I error is our significance level.
Type I error: Rejecting null hypothesis H0 even though it is true. Because it is so unlikely to get a statistic like that assuming the null hypothesis is true, we decide to reject the null hypothesis.
4. Power
This is the probability that you are doing the right thing when the null hypothesis is not true i.e. we should reject the null hypothesis if it’s not true.
Hence, Power = P(rejecting H0 | H0 is false)
= 1- P(not rejecting H0 | H0 is false) —> This is called Type II Error
= P( not making a Type II Error )

Example: Let H0: µ = µ1
Ha: µ ≠ µ1
Note:
1. If we increase ∝( significance level ), power increases i.e. ∝⇧ —> Power ⇧
But it also increases type I error i.e. P( type I error) ⇧
2. If we increase n (sample size), power increases i.e. n ⇧ —> Power ⇧
This in general is always a good thing. Increasing n causes narrower curve & overlapping between 2 curves reduces.3. Less variability (i.e. σ2 or σ) in data set also makes sampling distribution narrower so it increases Power. If the true parameter is further away than what the null hypothesis is saying then power increases.
5. Error probabilities and ∝ :
1. A Type I error is when we reject a true null hypothesis. Lower values of ∝ making it harder to reject the null hypothesis, so choosing lower values ∝ can reduce the probability of Type I error. The consequence here is that if the null hypothesis is false, it may be difficult to reject using lower values ∝. So using lower values ∝ can increase the probability of a Type II error.
2. A Type II error is when we fail to reject a false null hypothesis. Higher values of ∝ making it easier to reject the null hypothesis, so choosing higher values ∝ can reduce the probability of a Type II error. The consequence here is that if the null hypothesis is true, increasing ∝ makes it more likely that we commit a Type I error (rejecting a true null hypothesis).
Summary
Hypothesis Testing can be summarized using the following steps:
1. Formulate H0 and H1, and specify α.
2. Using the sampling distribution of an appropriate test statistic, determine a critical region of size α.
3. Determine the value of the test statistic from the sample data.
4. Check whether the value of the test statistic falls into the critical region and, accordingly, reject the null hypothesis, or reserve judgment. (Note that we do not accept the null hypothesis because β, the probability of false acceptance, is not specified in a test of significance.)
The media shown in this article are not owned by Analytics Vidhya and is used at the Author’s discretion.


