Data Storytelling: How to Tell a Great Story with Data?
Introduction
Data storytelling is a powerful tool that transforms complex data into compelling narratives, making insights more accessible and engaging. By leveraging data visualization, graphs, and infographics, data storytelling helps organizations present data-driven evidence in a way that drives meaningful decision-making and influences stakeholders effectively. This article delves into the significance of data storytelling, highlighting its components, benefits, and best practices. We will explore how data storytelling can enhance business intelligence, facilitate better data analysis, and empower individuals to make informed decisions through visually captivating presentations and dashboards.

Table of contents
- What is Data Storytelling?
- Why Do We Need Data Storytelling?
- Three Components of Data Storytelling
- Benefits of Data Storytelling
- How to Create Data Stories?
- Types of Data and Suitable Charts
- Data Storytelling During Predictive Modeling?
- Best Practices for Data Storytelling
- Using Data Visualization to Enhance Your Data Storytelling
- The Future of Data Storytelling
- Frequently Asked Questions
What is Data Storytelling?
Data storytelling communicates insights and information derived from data through compelling narratives, visuals, and data-driven evidence. It involves presenting data to make it easier for people to understand, engage with, and draw meaningful conclusions from the information presented. By weaving data into a cohesive and persuasive story, data storytelling enables organizations and individuals to make informed decisions, influence stakeholders, and create impactful presentations.
Why Do We Need Data Storytelling?
The art of Data storytelling is simple and complex at the same time. Stories provoke thought and bring out insights that could not have been understood or explained. However, it’s often overlooked in data-driven operations because we believe it’s trivial. We fail to understand that the best stories not presented well are useless!
In several firms, the first step towards analyzing anything is storyboarding. Questions like why do we have to analyze it? What decisions can we make out of it? Sometimes, data alone tells such visual and intricate stories that we don’t need to run complex correlations to confirm it.
The best example of needing stories and visuals to explain data is Anscombe’s Quartet. Anscombe’s Quartet is a set of four datasets with very similar statistical summaries but completely different when visualizing them.
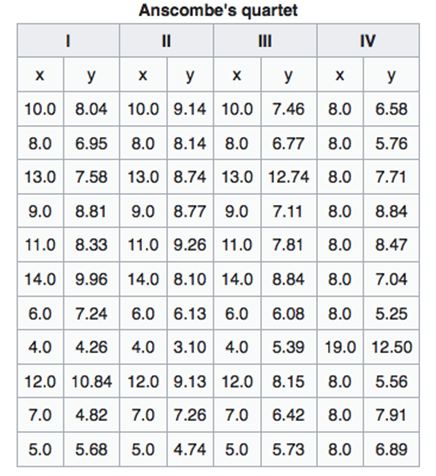
These are the four datasets used to depict the Anscombe’s Quartet. If we look at mere numbers, we find that their summary statistics are almost identical.
Let’s see how they appear when we visualize them.

Did you ever think these four quartets would have such varying visuals?
Three Components of Data Storytelling
- Data: This is the information we collect and analyze. It could be numbers, words, pictures, or other things we gather to learn.
- Story: This is like a tale we tell using the data. We organize the data to make sense and tell a story with a beginning, middle, and end. It’s like explaining why the data is important or interesting.
- Visualization: This means turning the data into pictures or graphs. Instead of just looking at numbers, we make charts or diagrams to help people understand the information better. It’s like painting a picture with the data.
Benefits of Data Storytelling
- Data storytelling makes complex data more accessible and understandable, allowing audiences to grasp insights easily.
- Engaging narratives and compelling visuals keep audiences hooked, increasing retention and attention.
- Storytelling with data empowers better decision-making by presenting evidence-based insights.
- Stories are memorable; data combined with storytelling creates a lasting impact on the audience.
- Convincing narratives backed by data builds trust and influences stakeholders effectively.
- Data storytelling adds a human touch, making data relatable and emotionally compelling.
- Data-driven stories create empathy, helping organizations connect with customers’ needs and experiences.
- Storytelling reveals trends and patterns hidden within data, leading to valuable discoveries.
- Data stories help identify and address challenges, promoting innovative problem-solving.
- Storytelling unifies teams around data, enabling better collaboration and shared vision.
- Data storytelling is a potent tool for advocating social causes and driving positive change.
- Organizations that excel in data storytelling gain a competitive edge in their industries.
- Data storytelling eliminates jargon and simplifies complexities, promoting clear communication.
- Understand customer preferences and behavior better through data-driven stories.
- Engaging data stories form the basis of powerful marketing campaigns.
Note: Make sure you check out the comprehensive multi-course Certified Business Analytics Program that covers the art of storytelling through various industry examples and using tools like Excel, Python and Tableau.
How to Create Data Stories?
To create a story or a plot is the first step to selling your ideas with a strong foot forward. Most people fail to think their stories through and cannot differentiate themselves from mediocrity. Let me take an example and guide you through creating stories.
We will explore a dataset with news headlines and details of every stock price from the NASDAQ 100 tech companies. The columns selected are as follows:

1. Begin With a Pen-paper Approach
Visually engaging presentations will inspire your audience, but they need more work. Some of the best presentations have been created on rough pages and tissue papers. Scripting down your ideas and flow before structuring your story is essential to your final product. The most important thing you can do to improve your analytics is to have a story to tell. A flow you can generate can have a lot of friction in your end result.
Aristotle’s classic five-point plan that helps deliver strong impacts is:
- Deliver a story or statement that arouses the audience’s interest.
- Pose a problem or question that has to be solved or answered.
- Offer a solution to the problem you raised.
- Describe specific benefits of adopting the course of action outlined in your solution.
- State a call to action.
I structured my report by involving plots that would help me better understand my data. My first idea was to use the data I had to make better business decisions about stocks.

A line graph would help me analyze trend lines of specific stock prices.
As I can see, all stocks dropped in February 2016. Scraping news articles only from that period would help me identify what caused the drop. Now, how do I select which news source to scrape from?

By identifying which news source reported most about a particular stock, we would have reason to believe that this source is a good source for that stock.
2. Dig Deeper to Identify the Sole Purpose of Your Story
- Identify closely the idea of your story. Ask yourself, “What am I giving with this story?” It’s never the story alone but what the story can do to improve decision-making. What you’re displaying is the idea of better decision-making or analytics.
- Develop a personal “passion statement.” In one sentence, tell your prospects and why you are genuinely excited about working with them. Your passion statement will be remembered long.

3. Use Powerful Headings
- Create your heading and a one-sentence statement for your story, visual, or analysis. The most effective headlines are concise, specific, and offer a personal benefit.
- Remember, your heading is a statement that offers your audience a vision of a better understanding. It’s not about you. It’s about them.
4. Design a Road-Map
- Create a list of all the key points you want your audience to know about your story, visual, or analysis.
- Categorize the list until you have only three major message points. This group of three will provide the verbal road map for your story.
- Add supporting evidence to enhance the narrative under each of your three key messages. This could include personal stories, facts, examples, analogies, etc.

5. Conclude with Brevity
Now that you have presented your story’s points, your conclusion should be short and powerful. In my report, I mentioned small 3-4 line summaries to conclude why to buy a particular stock.

Types of Data and Suitable Charts
Let us see the common types of data we encounter and how to tell stories from those by selecting the best-fit charts. Commonly encountered types of data:
Textual Data
When data is found in this form, it’s usually good to find how often a word has been used or what the sentiment of the text is. This form of data is best for telling stories. One of the best-suited visualizations for textual data is the WordCloud. The WordCloud brings the more frequent ones to the center and enlarges them, giving us a clear picture of the text’s general idea.

For example, the WordCloud in this article displayed above represents the Twitter dataset. It shows that love is the most frequent positive term used in tweets.
Mixed Data
When our data consists of numeric or any other variety of formats, we need to know which ones are important and give us better insights from our dataset.
The preferred visual for this kind of data can vary; here, I will show you how to use facet grids for the data using the Titanic Passenger Data.
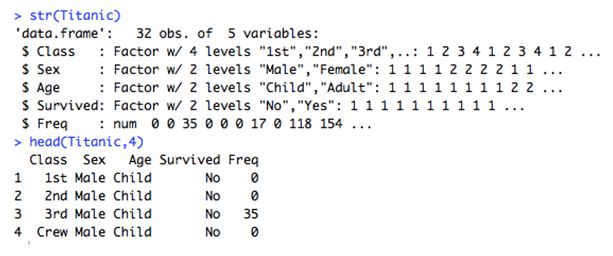

As this plot shows, females and first-class passengers have a higher survival chance than men in the crew or lower boarding classes.
Isn’t that what happened on the Titanic?
Another way to visualize this kind of data is to try a multivariate plot. This plot uses the Car Performance and Specifications dataset.
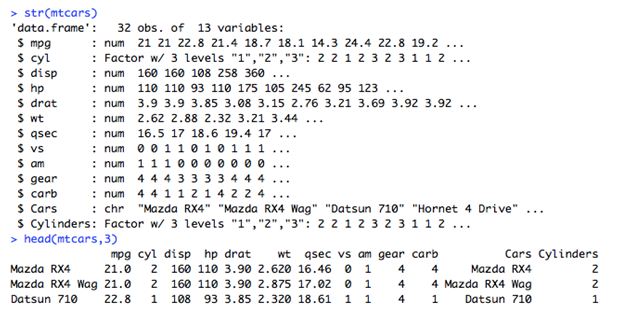
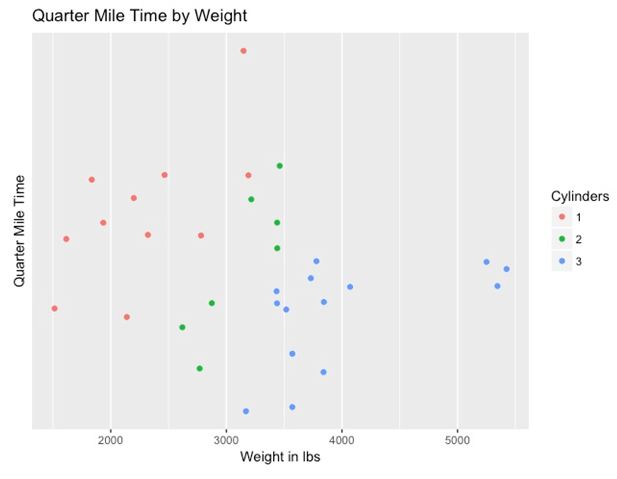
Here, we can see how cars with heavier builds are slower than those with lighter bodies. That makes sense, right?
Numeric Data
When we encounter this kind of data, we usually look for trends or lines that depict numbers. The visual that would suit numeric data best would be a line or a step graph.

Here, we can see the price rise at a local attraction for adults and children. How easy is it to see the growth at each year interval?
Stocks
One of the datasets that we also encounter is related to stocks. Stock market data is primarily time series data of numeric values, but as a trader or an investor, I would like to understand each date and drop carefully.
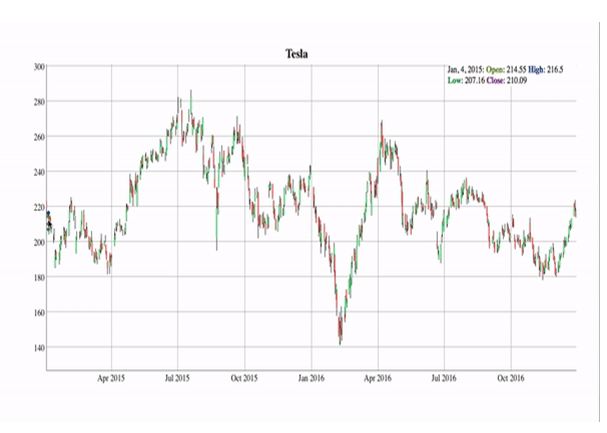
The most visually captivating chart in this regard is the Candlestick chart.

Here, we take the example of Tesla’s stocks. Candlestick charts can be used to maneuver across each date and see the individual stock lows and highs. This could help us make better investment decisions based on current or past market trends.
As the graph shows, Tesla’s stocks dropped in February 2016. We could now use this information to understand other market conditions and economic situations and make decisions about Tesla’s stock.
Geographic Data
When we have data about specific locations and areas, we use maps to add clarity and meaning to our analysis.

In this example, we can see how countries fared at and after the 2002 World Cup. Germany scored the maximum number of goals and has been one of the most dominant teams in world football ever since.
Data Storytelling During Predictive Modeling?
We are often questioned about how our stories and visuals can work or help when it’s time to create mathematical models. During all stages of predictive modeling, storytelling could be a vital addition to your analysis.
Let’s understand the basic steps involved in creating models from our data and then tell stories within them.
Data Exploration
The first step of model building is understanding your data. I’ll show you instances and how to explore your data without computing complex statistics.
Let’s consider a dataset on Wine Quality. This is the structure of the dataset is as follows

Here, we can see the associated summary statistics of the dataset.

So, if we need to see whether there is any correlation between alcohol volumes and wine qualities, how do we do it?
We could either compute Pearson’s ‘r.’ It would help us build a model but would not help us analyze much.

This shows a very strong correlation between Alcohol content and wine quality. But does it tell you anything else?
Ideally, it doesn’t. So, what does?
Let’s see how we can visualize these and tell much more about them.
First, we’ll see how Wine Quality relates to Alcohol content.

Here, we can see that the higher alcohol volumes relate to better wine qualities, which helps us better understand our data and spot outliers in this scenario.
Next, would you wonder how acid contents in your wine affect its quality?
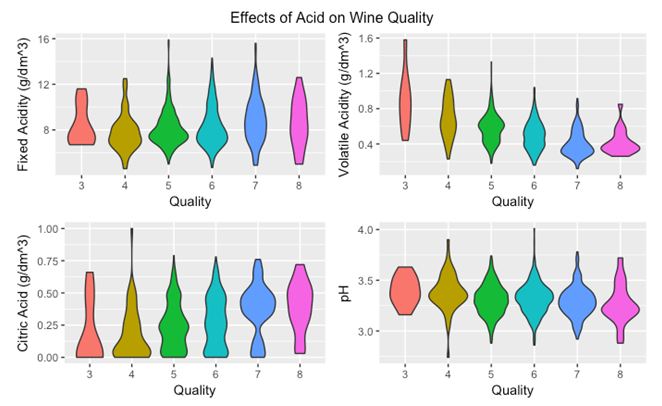
This would be one way to visualize the effects of acid. As the Violin Plot expands horizontally, it shows that there are higher numbers of data points within those areas.
Feature Visualizing
After you generate features, how do you see how well one is predicting?

Graphs tell us how far away our predicted points are from our fitted line.
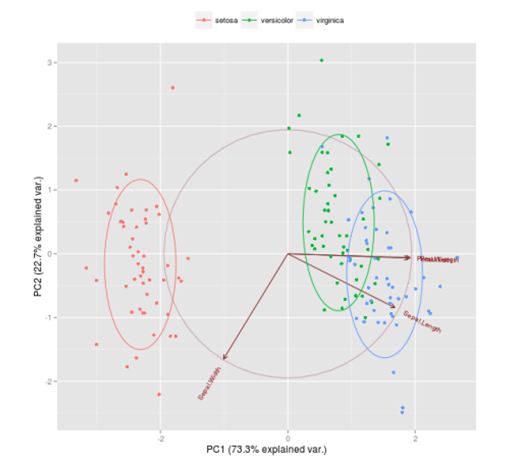
Another example where we might have to visualize newly created visuals is the Principal Component Analysis. If you want to get an in-depth understanding of PCA, you can go through this article.
This is the Iris dataset found in RStudio.

We find these statistics when we run the principal component analysis on this dataset.
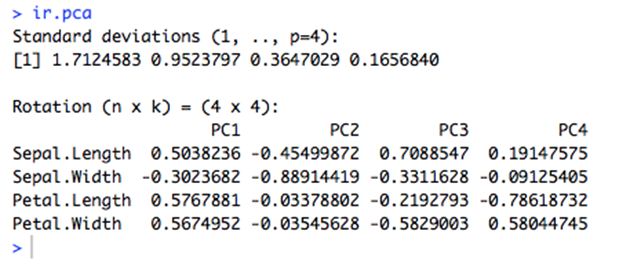
However, plotting this, we find that the resulting visual is much more informative than the statistics.
Model Creation and Comparison
Coming to the model creation phase, we usually find the need to understand how our data is being fitted.

This is a model that predicts whether the car should go fast or slow based on the grade of the road and bumpiness.
As you can see, the decision boundary classifies most of the data, but an accuracy of 88.21% doesn’t tell much of a story. Here, we can even see how far the misclassified points are from the decision boundary.
We can also compare certain algorithms and techniques by examining their decision boundaries, as we did above.
Another example using the Iris dataset is shown below.

There’s little information here to derive valuable insights about our model.

On the other hand, this plot shows a clear classification boundary where the Species separate.
Best Practices for Data Storytelling
Now that you know the scenarios where we can use story telling to explain our point, I will give you a few practical tips when you take this up on your own.
- Always label your axes and give the heading of your plot.
- Use legends where necessary.
- Use colors that are lighter on the eye and in proportion.
- Avoid adding unnecessary details, such as backgrounds or themes, to your visualization, making it difficult to read.
- Only a point can simultaneously encode two quantitative values based on a horizontal and vertical location.
- Never use points for visualization if you are doing time series encoding.
Using Data Visualization to Enhance Your Data Storytelling
Data visualization is a powerful tool to enhance data storytelling by making complex data more accessible, understandable, and engaging. Here are key strategies for using data visualization to elevate your data storytelling, along with examples:
Strategies for Using Data Visualization in Data Storytelling
- Choosing the Right Visualization Tools: Microsoft Power BI and Tableau offer robust features for creating dynamic and interactive visualizations. These tools help present data in a way that is not only visually appealing but also informative. Using these platforms, data analysts can create dashboards that provide a comprehensive data view, facilitating better understanding and analysis.
- Utilizing Templates and Best Practices: Leveraging pre-designed templates can save time and ensure consistency in your visual storytelling. Templates also help maintain a professional look, ensuring that your visualizations meet industry standards and effectively convey the intended message.
- Integrating Real-Time Data: Incorporating real-time data into your visualizations ensures that the information presented is current and relevant. This approach benefits marketing campaigns and social media analytics, where timely data is crucial for tracking and optimizing performance.
The Future of Data Storytelling
The future of data storytelling is set to evolve dramatically, leveraging advanced technologies and methodologies to create more impactful narratives. As we move forward, data storytelling will become an even more powerful tool for communicating complex data clearly and engagingly.
Enhanced Data Visualization Tools
Data visualization will continue to be a cornerstone of effective data storytelling. Tools like Tableau and Power BI are becoming more sophisticated, offering advanced features enabling data scientists and analysts to create more interactive and dynamic dashboards. These tools will allow users to present data in ways that are not only visually appealing but also provide real-time insights and actionable insights.
Integration of Advanced Data Analysis
As data analysis techniques improve, the ability to extract key insights from datasets will be enhanced. Data science will be crucial in uncovering hidden patterns and correlations within complex data, transforming raw data into valuable insights. This will empower organizations to make more informed, data-driven decisions.
Focus on Interactivity and Engagement
Future data storytelling will emphasize interactivity to engage audiences more effectively. Dashboards and infographics will become more interactive, allowing stakeholders to explore data on their own terms. This will help drive a deeper understanding of the data and facilitate better decision-making processes.
Real-time Data and Dynamic Storytelling
The ability to incorporate real-time data into narratives will revolutionize data storytelling. Business intelligence platforms will integrate real-time data streams, enabling the creation of continuously updated stories with the latest information. This dynamic approach will ensure that stakeholders always have access to the most current data, leading to more timely and accurate business decisions.
Personalized and Contextual Storytelling
Data stories will become more personalized and context-specific in the future. By leveraging advanced analytics and data visualization tools, organizations can tailor stories to different audiences, ensuring each good data story resonates with its intended audience. This approach will be particularly effective in marketing campaigns, where personalized data stories can drive higher conversions.
Collaboration and Accessibility
Platforms like Microsoft Power BI and Tableau will continue to make data storytelling more accessible to a broader range of users, including non-technical learners. These platforms will offer templates and spreadsheets that simplify creating compelling narratives, allowing even those without extensive data expertise to contribute.
Data Storytelling in Social Media and Podcasts
Integrating data storytelling into social media and podcasts will expand its reach. Platforms like Spotify are already experimenting with data-driven content, and this trend is likely to grow. By embedding data stories in these mediums, organizations can reach wider audiences and engage them with compelling narratives based on data insights.
Ethical and Responsible Data Use
As data’s power grows, so will the responsibility to use it ethically. Future data storytelling must ensure transparency, accuracy, and privacy, particularly as datasets become more detailed and personal. This ethical approach will be crucial in maintaining trust and credibility with audiences.
Conclusion
In an era where data drives decision-making, data storytelling is indispensable for translating complex information into actionable insights. Using advanced data visualization tools like Power BI and Tableau, data analysts and scientists can create interactive dashboards and compelling narratives that resonate with stakeholders. Effective data storytelling not only simplifies data complexities but also builds trust drives change and enhances the impact of marketing campaigns. As we move forward, integrating real-time data and personalized storytelling will further revolutionize how we present and interpret data, ensuring that the power of data is harnessed to its fullest potential.
Sign up for the Certified AI & ML Program by Analytics Vidhya to elevate your data storytelling skills to new heights. Unleash the potential of industry examples, Excel, Python, and Tableau, and become a storytelling expert. Explore the program now!
Frequently Asked Questions
A. Data storytelling conveys data-driven insights and analysis through a compelling narrative that engages and informs the audience, making data more understandable and actionable.
A. The three key elements of data storytelling are data, visualization, and narrative. Data provides the foundation, visualization aids in comprehension, and a well-crafted narrative contextualizes and communicates the insights.
A. Data Analysis: Extracting insights from data using statistical methods.
Data Storytelling: Communicating insights through engaging narratives and visuals.
Focus: Analysis is about uncovering patterns; storytelling is about communication.
Techniques: Analysis uses statistical methods; storytelling uses narratives and visuals.
Purpose: Analysis uncovers insights; storytelling communicates them effectively.
Audience Engagement: Analysis informs; storytelling engages and influences.
A. An example of data storytelling could be a presentation that uses data and visualizations to explain the impact of a marketing campaign on sales, highlighting the key metrics, trends, and the story of how the campaign led to business growth.


Such an important topic in Data Analysis. Great article - thanks for your insights. Do you have a favourite storyboard tool?
Thanks a lot, David! I've been very loyal to PowerBI by Microsoft, and it's yielded me fabulous results as well :)
Great article. Some very good clues on presenting data.
Thanks a lot!
Very Informative. The Concept of story telling using data visualization has been explained very well
Thank you, Pragati!
Thanks a lot Shantanu! I learnt few things from this.
Thanks a lot, Vineet! :)
Dear Kumar, This is so nsightful. Thank you for this masterpiece
Glad I could help, Frederick!
This is a really insightful article; I love the layout, how depth it is and the visual aids coupled with some well-explained situations. Thanks for sharing!
Thanks, Brandon! Means a lot :)
Thanks for such a comprehensive article. Great piece information and work.
Thank you! :)
Great article.well done
Thanks!
Lovely story told:) Enjoyed reading...
Hi I am ba graduate with 5 years exp in bpo. Can I do this course data scientist without it background. Can anyone suggest me
Thank you for this educational experience. It’s more a post. Reading this was a college class. Wow! Thank you.
Thanks a lot, Glenda! Glad you liked it :)
Hello Shantanu, have you published any research papers on data analytics. Please let me know, if you have published any. I will go through them.
Hi Sridevi! Yes I have, you can find it on my LinkedIn that is associated with my author profile. Thanks for your time!
Learnt some new things in a great way. Thanks Shantanu :)
Thanks a lot, Gaurav! :D
This is amazing and it will help me to make good stories out of my data.
Great Insights! Do you conduct workshops also on similar topics.
Nice writeup
Such an important topic in Data Analysis very informative Great article - thanks for your insights.
Thank you for this educational experience. It’s more a post. Reading this was a college class. Wow! Thank you.