Understanding Fuzzy C Means Clustering
Introduction
Clustering is an unsupervised machine learning algorithm that groups together similar data points based on criteria like shared attributes. Each cluster has data points that are similar to the other data points in the cluster while as a whole, the cluster is dissimilar to other data points. By making use of clustering algorithms, we can uncover hidden structures, patterns, and correlations in the data. Fuzzy C Means (FCM) is one among the variety of clustering algorithms. What makes it stand out as a powerful clustering technique is that it can handle complex, overlapping clusters. Let us understand this technique better through this article.

Learning Objectives
- Understand what Fuzzy C Means is.
- Know how the Fuzzy C Means algorithm works.
- Be able to differentiate between Fuzzy C Means and K Means.
- Learn to implement Fuzzy C Means using Python.
This article was published as a part of the Data Science Blogathon.
Table of Contents
What is Fuzzy C Means?
Fuzzy C Means is a soft clustering technique in which every data point is assigned a cluster along with the probability of it being in the cluster.
But wait! What is soft clustering?
Before getting into Fuzzy C Means, let us understand what soft clustering means and how it is different from hard clustering.
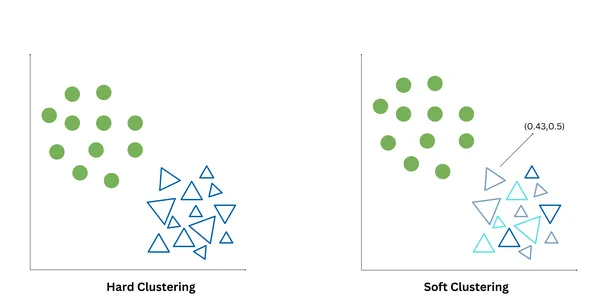
Hard clustering and soft clustering are two different ways to partition data points into clusters. Hard clustering, also known as crisp clustering, assigns each data point exactly to one cluster, based on some criteria like for example – the proximity of the data point to the cluster centroid. It produces non-overlapping clusters. K-Means is an example of hard clustering.
Soft clustering, also known as fuzzy clustering or probabilistic clustering, assigns each data point a degree of membership/probability values that indicate the likelihood of a data point belonging to each cluster. Soft clustering allows the representation of data points that may belong to multiple clusters. Fuzzy C Means and Gaussian Mixed Models are examples of Soft clustering.
Working of Fuzzy C Means
Now that we are clear with the difference in hard and soft clustering, let us understand the working of the Fuzzy C Means algorithm.
How to Run the FCM Algorithm
- Initialization: Randomly choose and initialize cluster centroids from the data set and specify a fuzziness parameter (m) to control the degree of fuzziness in the clustering.
- Membership Update: Calculate the degree of membership for each data point to each cluster based on its distance to the cluster centroids using a distance metric (ex: Euclidean distance).
- Centroid Update: Update the centroid value and recalculate the cluster centroids based on the updated membership values.
- Convergence Check: Repeat steps 2 and 3 until a specified number of iterations is reached or the membership values and centroids converge to stable values.
The Maths Behind Fuzzy C Means
In a traditional k-means algorithm, we mathematically solve it via the following steps:
- Randomly initialize the cluster centers, based on the k-value.
- Calculate the distance to each centroid using a distance metric. Ex: Euclidean distance, Manhattan distance.
- Assign the clusters to each data point and then form k-clusters.
- For each cluster, compute the mean of the data points belonging to that cluster and then update the centroid of each cluster.
- Update until the centroids don’t change or a pre-defined number of iterations are over.
But in Fuzzy C-Means, the algorithm differs.
1. Our objective is to minimize the objective function which is as follows:
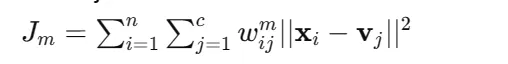
Here:
n = number of data point
c = number of clusters
x = ‘i’ data point
v = centroid of ‘j’ cluster
w = membership value of data point of i to cluster j
m = fuzziness parameter (m>1)
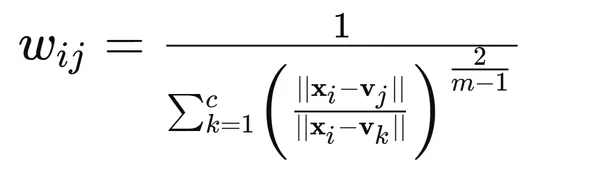
2. Update the membership values using the formula:
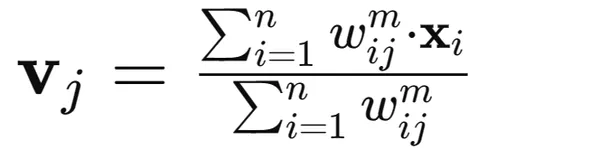
3. Update cluster centroid values using a weighted average of the data points:
4. Keep updating the membership values and the cluster centers until the membership values and cluster centers stop changing significantly or when a predefined number of iterations is reached.
5. Assign each data point to the cluster or multiple clusters for which it has the highest membership value.
How is Fuzzy C Means Different from K-Means?
There are various differences in both these clustering algorithms. A few of them are:
| Fuzzy C Means | K-Means |
| Each data point is assigned a degree of membership to each cluster, indicating the probability or likelihood of the point belonging to each cluster. | Each data point is exclusively assigned to one and only one cluster, based on the closest centroid, typically determined using Euclidean distance. |
| It does not impose any constraints on the shape or variance of clusters. It can handle clusters of different shapes and sizes, making it more flexible. | It assumes that clusters are spherical and have equal variance. Thus it may not perform well with clusters of non-spherical shapes or varying sizes. |
| It is less sensitive to noise and outliers as it allows for soft, probabilistic cluster assignments. | It is sensitive to noise and outliers in the data |
Implementation of FCM Using Python
Let us now implement Fuzzy C Means using Python.
I have downloaded the dataset from the following source: mall_customers.csv · GitHub
!pip install scikit-fuzzy
import pandas as pd
import numpy as np
import matplotlib.pyplot as plt
import seaborn as sns
import skfuzzy as fuzz
from sklearn.preprocessing import StandardScaler
###Load and explore the dataset
data = pd.read_csv("/content/mall_customers.csv")
# Display the first few rows of the dataset and check for missing values
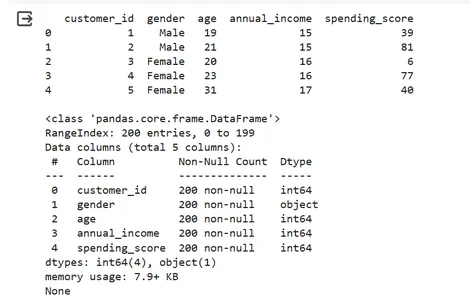
print(data.head(),"\n")
print(data.info())
# Preprocess the data
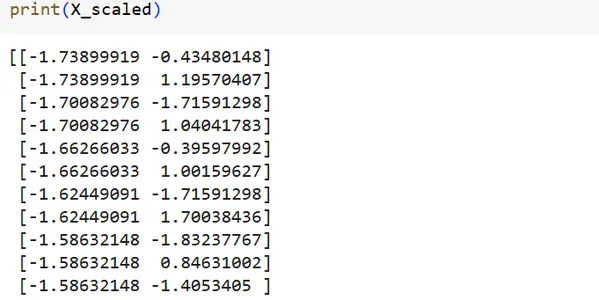
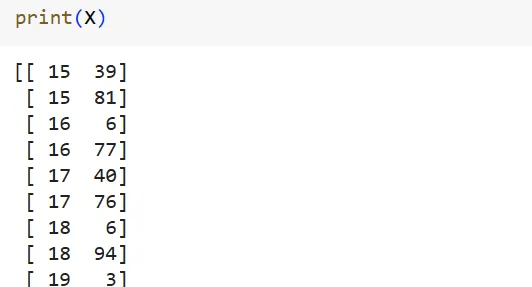
X = data[['Annual Income (k$)', 'Spending Score (1-100)']].values
print(X)
# Scale the features
scaler = StandardScaler()
X_scaled = scaler.fit_transform(X)
print(X_scaled)
#Apply Fuzzy C Means clustering
n_clusters = 5 # Number of clusters
m = 2 # Fuzziness parameter
cntr, u, u0,d,jm,p, fpc = fuzz.cluster.cmeans(
X_scaled.T, n_clusters, m, error=0.005, maxiter=1000, init=None
)
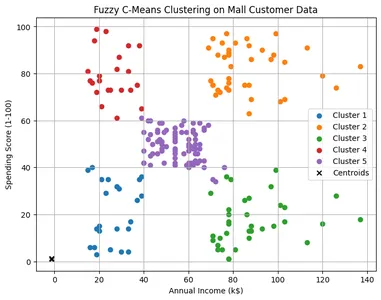
# Visualize the clusters
cluster_membership = np.argmax(u, axis=0)
plt.figure(figsize=(8, 6))
for i in range(n_clusters):
plt.scatter(X[cluster_membership == i, 0], X[cluster_membership == i, 1], label=f'Cluster {i+1}')
plt.scatter(cntr[0], cntr[1], marker='x', color='black', label='Centroids')
plt.title('Fuzzy C-Means Clustering on Mall Customer Data')
plt.xlabel('Annual Income (k$)')
plt.ylabel('Spending Score (1-100)')
plt.legend()
plt.grid(True)
plt.show()Here:
- data: The input data matrix, where each row represents a data point and each column represents a feature.
- clusters: The number of clusters to be formed.
- m: The fuzziness exponent, which controls the degree of fuzziness in the clustering.
- error: The termination criterion specifies the minimum change in the partition matrix (u) between consecutive iterations. If the change falls below this threshold, the algorithm terminates.
- maxiter: The maximum number of iterations allowed for the algorithm to converge. If the algorithm does not converge within this limit, it terminates prematurely.
- init: The initial cluster centers. If None, random initialization is used.
The function returns the following:
- u: The final fuzzy partition matrix, where each element u[i, j] represents the degree of membership.
- u0: The initial fuzzy partition matrix.
- d: The final distance matrix, where each element d[i, j] represents the distance between the i-th data point and the j-th cluster centroid.
- jm: The objective function value at each iteration of the algorithm.
- p: The final number of iterations performed by the algorithm.
- fpc: The fuzzy partition coefficient (FPC), which measures the quality of the clustering solution.
Output:
Applications of FCM
Here are the 5 most common applications of the FCM algorithm:
- Image Segmentation: Segmenting images into meaningful regions based on pixel intensities.
- Pattern Recognition: Recognizing patterns and structures in datasets with complex relationships.
- Medical Imaging: Analyzing medical images to identify regions of interest or anomalies.
- Customer Segmentation: Segmenting customers based on their purchasing behavior.
- Bioinformatics: Clustering gene expression data to identify co-expressed genes with similar functions.
Advantages and Disadvantages of FCM
Now, let’s discuss the advantages and disadvantages of using Fuzzy C Means.
Advantages
- Robustness to Noise: FCM is less sensitive to outliers and noise compared to traditional clustering algorithms.
- Soft Assignments: Provides soft, probabilistic assignments.
- Flexibility: Can accommodate overlapping clusters and varying degrees of cluster membership.
Limitations
- Sensitivity to Initializations: Performance is sensitive to the initial placement of cluster centroids.
- Computational Complexity: The iterative nature of FCM can increase computational expense, especially for large datasets.
- Selection of Parameters: Choosing appropriate values for parameters such as the fuzziness parameter (m) can impact the quality of the clustering results.
Conclusion
Fuzzy C Means is a clustering algorithm that is very diverse and quite powerful in uncovering hidden meanings (in the form of patterns) in data, offering flexibility in handling complex datasets. It can be considered a better algorithm compared to the k-means algorithm. By understanding its principles, applications, advantages, and limitations, data scientists and practitioners can leverage this clustering algorithm effectively to extract valuable insights from their data, making well-informed decisions.
Key Takeaways
- Fuzzy C Means is a soft clustering technique allowing for probabilistic cluster assignments, contrasting with the exclusive assignments of hard clustering algorithms like K-Means.
- It iteratively updates cluster membership and centroids, minimizing an objective function to achieve convergence and uncover complex, overlapping clusters.
- Unlike K-Means, FCM is less sensitive to noise and outliers due to its probabilistic approach, making it suitable for datasets with varied structures.
- Python implementation of FCM using libraries like scikit-fuzzy enables practitioners to apply this technique efficiently to real-world datasets, facilitating data analysis and decision-making.
Frequently Asked Questions
A. Fuzzy C Means is a clustering algorithm that aims to improve the existing K-Means algorithm by allowing soft assignments of clusters to data points, based on the degree of membership/probability values so that data points can belong to multiple clusters.
A. Jim Bezdek developed the general case in 1973 for any m>1. He developed this in his PhD thesis at Cornell University. Joe Dunn first reported the FCM algorithm in 1974 for a special case (m=2).
A. Fuzziness parameter controls the degree of fuzziness or uncertainty in cluster assignments. For example: if m=1, then the data point will belong only to one cluster. Whereas, if m=2, then the data point has a degree of membership equal to 0.8 for one cluster, and a membership value equal to 0.2 for another cluster. This indicates that there is a high chance of the data point belonging to cluster 1 while also a chance of it belonging to cluster 2.
A. They are updated iteratively by performing a weighted average of the data points where the weights are the membership values of each data point.
A. Yes! Some of the fuzzy clustering algorithms apart from FCM are the Gustafson-Kessel algorithm and the Gath-Geva algorithm.
The media shown in this article on Data Visualization Tools are not owned by Analytics Vidhya and is used at the Author’s discretion.


The article is just amazing. It is very clear and concise looks like the the author has done pretty good job in researching about the topic as it's definitely reflected in the blog. Great work!!
Well explained Aditi, Keep growing, All the best