
Abstract
This research investigates the finite element analysis (FEA) of cold-formed steel (CFS) L-columns with pin-ended supports under compression. The study involves a comprehensive parametric analysis with 110 FE models to assess the effects of section thickness and material yield stress on the axial strength of CFS L- columns. On the basis of the findings from this parametric study, a new design equation for determining the compression strength of CFS L- columns was proposed. This new equation demonstrated superior performance compared with the direct strength method (DSM) equations specified in the American (AISI S100-16) and Australian/New Zealand (AS/NZS 4600:2018) standazrds. To further validate the proposed design equation, a comparison with the finite element analysis (FEA) results was conducted. In addition, machine learning (ML) techniques were employed to forecast the load-bearing capacity of cold-formed sections. The predictions made from ML models were compared, including the FEM and the proposed equation. Evaluation metrics were used to compare predictions from various models, such as XGB, AB, RF, CB, FEM, and the newly introduced design equation, were used to compare predictions accuracy. All models showed similar high R2 values (0.99), indicating accurate and reliable axial capacity predictions.
Introduction
The increasing use of cold-formed steel (CFS) in the construction industry can be attributed to its advantageous properties, such as ease of erection, lightweight nature, straightforward fabrication, and cost-effectiveness. Typically, I-sections, C-sections, and L-sections are employed for non-structural applications1. However, for load-bearing structures such as beams, columns, trusses, struts, and sheet piles, built-up sections formed by combining two or more sections are utilized to increase their load-carrying capacity. Given the prevalent use of these sections, there is a pressing need to explore and enhance their performance. This requires thorough research on the behavior of these sections by modifying their cross-sectional shapes to optimize their structural properties2. Experimental studies or validated numerical simulations are essential for understanding how these sections perform under various conditions. Specifically, L-sections, owing to their asymmetrical nature, exhibit complex structural behavior when subjected to centriole compression. Factors such as the shear center not aligning with the centroid of the section, as well as the effects of torsional stiffness and warp resistance, contribute to this complexity3. Therefore, this investigation is focused on examining the structural behavior of pin-ended CFS L-sections under centriole compression, aiming to identify and address the challenges posed by their unique structural characteristics.
The buckling responses of CFS compression members with L sections have attracted the attention of distinctive investigators. Peköz4 studied the behavior of CFS L columns by conducting experiments and suggested accounting for a supplementary moment of PL/1000 (where P is the compressive axial strength and L is the column length) relative to the secondary principal axis of the members. Popovic5,6 conducted a set of compression tests on a CFS L section with fixed and pin-ended support states and proposed the omission of flexural-tortional buckling (FTF) from Australia/New Zealand and suggested that one and only minor-axis flexural buckling (FF) should be measured. Young7 performed axial compression experiments on a fixed-ended L section and proposed design guidelines for slender and nonslender fixed-ended L columns. Rasmussen8 labeled a new design approach for slender equal-leg angles that ignored torsional force when finding the overall buckling stress and used newly offered effective width equations to exactly calculate the bending strength of such L sections. Dinis et al.9,10,11 studied the postbuckling behaviors of L columns with pined and fixed end conditions and proposed new design approaches grounded in the direct strength method (DSM), where the dissimilarities with respect to the buckling behavior of the member were noted. Similarly, Dinis and Camotim10 established a novel design methodology for thin-walled fixed- and pin-ended L columns built from the design rules of the DSM, which included the use of length-dependent flexural‒torsional strength curves and considered the relationship with the two global modes, including the FTB and FB.
Furthermore, Zhang et al.12 investigated the behavior of a nonsymmetric CFS angular column section with a complex edge stiffener subjected to eccentric loading and proposed design equations for calculating the strength of such columns under eccentric compression. Natesan and Madhavan13 investigated the behavior of bolted L-shaped sleeve joints connecting cold-formed steel (CFS) channel sections through experimental testing under three-point bending. The results show that specimens with a 2.5 mm thick sleeve connector had significantly greater moment resistance than those with a 2.0 mm thick sleeve connector did, and design predictor equations were proposed on the basis of the findings14. Ananthi et al. used an increasing number of back-to-back built-up CFS unequal angle sections; this study presents 77 results, showing that stiffeners improve the axial capacity by 20% and validating a finite element model, which suggests that the current direct strength method (DSM) is reliable and conservative by 14% on average. Wang et al.15 introduced L-shaped columns made from thin-walled square steel tubes with self-drilling screw connections, which are suitable for low-rise buildings because of their ease of transportation and assembly. The research included eccentric compression tests and finite element modeling, leading to the development and validation of a formula for estimating the ultimate bearing capacity of these columns. In addition to efforts to determine the buckling response and capacity of fixed-ended CFS L columns, the comprehensive behavior of such columns with pin-ended boundary conditions requires more research.
Landesmann et al.16 examined the complex behavior of short-to-intermediate equal-leg angle columns and their current exclusion from prequalification for the direct strength method (DSM) and LFRD resistance factor in North American standards. It introduces a novel DSM-based design approach, which is validated through numerical methods due to the lack of experimental failure loads for slender pin-ended columns. The study, conducted at the Federal University of Rio de Janeiro, presents detailed experimental results on these columns, including initial imperfections, equilibrium paths, deformed configurations, and failure loads. These findings are used to validate a previously developed shell finite model, which shows excellent correlation with both the experimental and numerical results. The paper concludes by proposing minor revisions to design expressions to increase accuracy and facilitate future codification. Cruz and Landesmann9,16 conducted experiments on CFS L-sections subjected to compression. They tested five distinct cross-sectional geometries with specimen heights ranging from 500 to 1200 mm. The specimens were loaded using a universal testing machine (UTM) with a capacity of 1000 kN. The test results from Cruz et al. were utilized to validate the non-linear finite element model developed in this study. XGB is a fast and efficient algorithm that is capable of handling large datasets with ease. It often outperforms other algorithms in terms of speed and accuracy. Its performance can be further enhanced through tuning. It supports parallel and distributed computing and is platform independent. It offers a range of customization features, including regularization, cross-validation, and early stopping17,18. Adaptive boosting (AB) is extensively utilized in various applications, including facial detection, object recognition, and text classification. Its effectiveness is particularly effective in scenarios involving noisy data or numerous irrelevant features. Beyond these applications, AB is also applicable in other machine learning domains, such as regression and clustering19,20. Random forest models offer robust performance by combining multiple decision trees, which enhances accuracy and reduces the risk of overfitting. Their ensemble approach also provides insights into feature importance, making them versatile for various data analysis tasks21,22,23. Categorical feature boosting (CB) offers several advantages, including its ability to handle categorical features directly without preprocessing and its robust performance on a variety of data types and distributions. It also incorporates gradient boosting with sophisticated techniques to minimize overfitting and enhance predictive accuracy24.
Traditional load prediction methods often rely on extensive physical testing, which can be time-consuming and expensive. Machine learning and numerical methods can significantly reduce the need for such testing by accurately predicting the load on the basis of available data. This saves resources and accelerates the design and manufacturing processes. The finite element method enables a comprehensive and detailed investigation of the post buckling behavior of cold-formed steel lipped channel columns, offering valuable insights into their performance and failure mechanisms under complex loading scenarios25,26. The direct strength method (DSM) for thin-walled cold-formed steel (CFS) structural members, introduced twenty years ago, has evolved significantly, expanding from initial research on simple members to now encompassing complex loading, buckling interactions, and system-level implementations, demonstrating its growing applicability and efficiency in structural predictions27,28,29.
The axial compressive behavior predictive models for Σ-section structures benefit from Finite element analysis (FEA), experimental methods and machine learning. The study declares that XGB provides the best accuracy among predictive tools because it uses SHAP analysis to identify parameter significance and enhance structural assessments30. The multilayer perceptron (MLP) model achieved high prediction accuracy for cold-formed steel profile load-bearing capacity developed by Yılmaz et al.31. Section thickness together with flange length determine the potential strength of a structure. The combination of Deep Belief Network (DBN) and Genetic Algorithm (GA) proposed by Dai et al.32 produced axial strength improvement of 184.7% above conventional designs while surpassing Direct Strength Method (DSM) prediction results. Xiao et al.33 utilized machine learning together with genetic algorithms to optimize cold-formed steel built-up columns and reached up to 91% strength improvement under constant material usage. Chen et al.34 presented an advanced DSM-based design procedure which incorporated machine learning techniques to optimize structural response predictions. Rajneesh et al.35 applied Random Forest with SHAP analysis to predict cold-formed steel section axial load capacity while reaching a 99.10% accuracy level. The proposed machine learning model from Lu et al.36 carried enhanced accuracy for multi-limbed built-up open-section columns compared to conventional approaches. Rabi et al.37 created an ANN-based design method for cold-rolled CHS beam-columns that validated its results against EC3. The unified design process for stainless steel CHS columns built by Xu et al.38 outpaced traditional design methods with its improved accuracy.Research about cold-formed steel L-sections concentrates primarily on fixed-ended conditions while pin-ended configurations remain understudied. Warping effects and torsional issues run beyond the current limitations of Direct Strength Method (DSM) equations for pin-ended L-sections so their provisions need to be enhanced. FEA studies need better investigations of section size variations and material property assessments. Research shows that prediction of axial capacity through machine learning (ML) models exhibits potential despite the absence of direct comparison against FEA and DSM. The research fills these gaps through combined FEA modeling and DSM equation refinement and ML prediction assessment for improved CFS L-column axial strength analysis.
This paper presents a comprehensive numerical study focusing on the axial strength of cold-formed steel (CFS) L columns. A total of 110 finite element (FE) models were meticulously analyzed to investigate various parametric influences on the axial strength of these columns. This study aims to offer design improvements on the basis of the outcomes derived from finite element analysis (FEA). Specifically, it proposes modifications to the design strength method (DSM) equations to better estimate the axial capacity of pin-ended CFS L columns. The paper details an extensive evaluation comparing the axial strength predictions generated by the FEA against those provided by the newly proposed design equations. This comparison demonstrated that the suggested design equations closely align with the FEA results, offering a reliable method for estimating the axial strength of pin-ended CFS L columns.
Furthermore, this study incorporates machine learning (ML) techniques to forecast the load-bearing capacity of cold-formed sections. This ML-based approach is then contrasted with numerical methods such as the FEM and the newly proposed equation. To evaluate the performance of these predictive models, several metrics are employed, including R2RMSE, VAF, PI, MAPE, MAE, the SD ratio, TIC and IA. To facilitate comparison, Tailor’s diagram, accuracy analysis, error analysis, score analysis, and prediction curve criteria are used. These tools help assess the accuracy and reliability of different prediction methods, providing a comprehensive evaluation of their effectiveness. This study aims to determine which method, whether the FEM, the proposed equation, or the ML approach, offers the most accurate and reliable predictions for the axial strength of CFS L columns, thus contributing valuable insights to the field of structural engineering and design.
Research significance
This research holds significant value in the field of structural engineering because it addresses the challenges associated with the design and analysis of cold-formed steel (CFS) L-columns under centriole compression. Through a detailed finite element analysis (FEA), this study advances the understanding of the axial strength of CFS L-sections by developing a robust non-linear FE model that accounts for both material non-linearities and initial geometric irregularities. This model’s validation against experimental data enhances its credibility and provides a solid foundation for subsequent analyses. By conducting a comprehensive parametric study involving 110 FE models, this research thoroughly examines the impacts of section thickness and material yield stress on the axial capacity of these columns, leading to the formulation of a new design equation. This equation not only offers an improvement over existing direct strength method (DSM) equations but also shows superior performance in predicting the compression strength of CFS L-sections compared with established standards such as AISI S100-16 and AS/NZS 4600:2018. Additionally, the integration of machine learning (ML) techniques in this study adds a novel dimension to predict the load-bearing capacity of cold-formed sections. By comparing ML predictions with those from finite element models and the proposed design equation, this research provides a thorough evaluation of various predictive methods. High R² values across models signify the accuracy and reliability of the predictions. Employing metrics such as the RMSE, VAF, and AIC, alongside Tailor’s diagram and predicted curves, ensures a rigorous assessment of model performance. Ultimately, this study offers valuable insights into improving design methods for CFS L-columns, advancing both theoretical understanding and practical applications in structural engineering.
Methodology
Finite element analyses
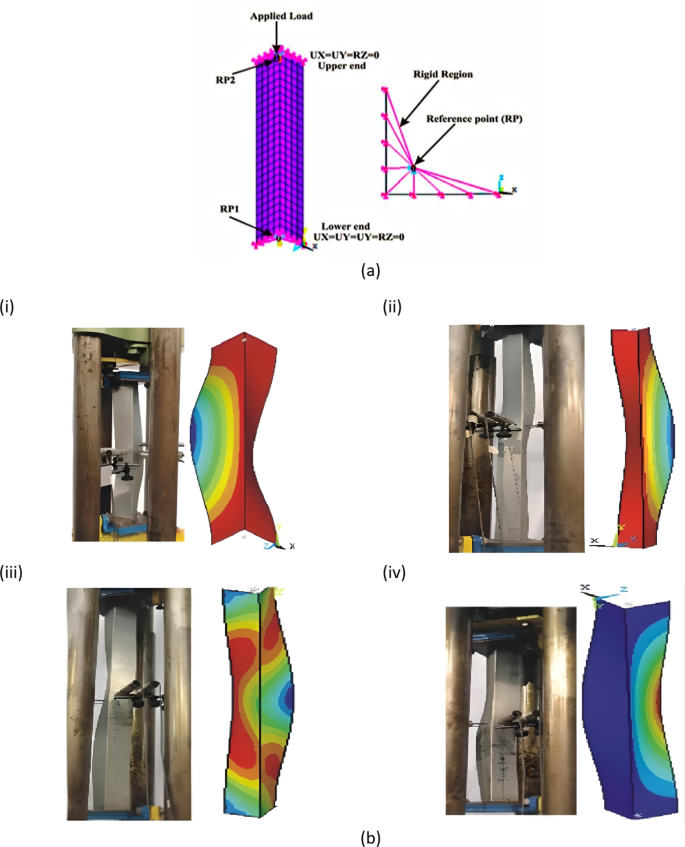
In this study, ANSYS [19.1] was employed to enhance a finite element (FE) model specifically designed for analyzing pin-ended cold-formed steel (CFS) L-columns subjected to axial compression. To accurately represent the structural behavior of these columns, Shell181 elements were used in the FE model. Shell181 elements are 4-noded thin-shell elements that incorporate shear deformation effects, providing six degrees of freedom per node. This element type is known for its comprehensive ability to model complex interactions and deformations in thin-shell structures. The investigation revealed that a mesh configuration with 25 mm² square elements achieved precise results while balancing computational efficiency. This specific mesh size provided an optimal trade-off between accuracy and the computational resources needed, ensuring that the model could deliver reliable predictions without excessive computational demands. The FEA modeling details are shown in Fig. 1(a). A comparison of the failure modes found via finite element analysis (FEA) and experimental tests for structural elements under loading is shown in Fig. 1(b). Figure 1(b) illustrates how well the FEA simulations replicate the failure modes observed in practical tests, with varying configurations and loading scenarios9,16. This agreement between the experimental and simulation results confirms that FEA is a reliable prediction method for assessing structural failure and stability under compressive loads. Based on the literature, the validation of the FEM is conducted using minimal data39,40,41,42,43.
Section modeling properties and boundary conditions
Elastic-fully plastic material models were used. The values of E and ν were 205 GPa and 0.30, respectively, and four different yield stresses (\(\:{f}_{y}\) = 304.5, 270, 304 and 500 MPa) were used for validation and parametric study. Pin-ended supports were modeled by attaching the ends of the angles to the stiff plates, thus confirming that full secondary warping and local displacement/rotation constraints were provided, which disallowed flexural displacements, major-axis flexural rotations and torsional rotations. Initial geometric irregularities were included in the FE models. Every buckling mode shape was resolved by the resources of an initial ANSYS SFE buckling analysis, which was achieved with exactly the similar mesh employed to accomplish the consequent nonlinear investigation. The first analysis performs a linear buckling analysis to reveal the buckling shape and pattern shapes. The determination of buckling shape should get scaled by using defined factors representing element length percentage or design specification. The nonlinear analysis follows the application of an initial displacement field generated from the scaled imperfection shape. Authorities must check that the initial geometric imperfection magnitude stays within practical values to ensure analysis validity. This technique makes it easy to transform the buckling analysis output into a nonlinear input. No residual stress or corner strength enhancements were built into the FE model; on the basis of the findings of the literature from9,16,44,45the combined impact of strain hardening, residual stresses and rounded junction properties has a slight influence on the capacity and buckling behavior of CFS L columns.
Confirmation of the FE model
The experimental findings from Cruz et al.9,16 were used to confirm the FE model established in this study. The axial strengths acquired from the tests of Cruz et al.9,16 and the FEA accomplished in this study are compared in Table 1. As presented in Table 1, the average ratio of the experimental to FEA results (\(\:{P}_{EXP}/{P}_{ANSYS}\)) is 0.99, with a coefficient of variation (COV) of 0.06. Therefore, the FE models can be used to calculate the strength of the CFS L columns thoroughly.
Parametric study
By means of the confirmed FE model, a detailed parametric study was performed to study the influence of different parameters on the axial strength of the CFS L columns (see Fig. 2(a) and Table 2)). The parametrically investigated columns were categorized such that the nominal dimensions of the L leg, section thickness, column slenderness ratio and yield stress were labeled (Fig. 2(b)).

Section dimensions and specimen labeling used in the parametric study; (a) section dimensions; (b) specimen labeling.
To create a wide range of data points, the following parameters were varied: vertical leg width (Wv) from 80 to 100 mm; horizontal leg width (WH) from 80 to 100 mm; section thickness (t) from 1.2 to 3 mm; yield stress (fy) from 270 to 500 MPa; and column slenderness ratio (λ) from 20 to 120. The overall width of the lip (WL) and width of the rear lip (WRL) were fixed at 20 mm. In total, 110 FEA models were analyzed, and the FEA results are summarized in Table 4.
DSM design rules
Current design rules46,47
As per the guidelines outlined in the direct strength method (DSM) for design, the initial design strength without applying factors (\(\:{P}_{D1}\)) for plain sections is determined by evaluating the minimum values of strengths corresponding to flexural buckling (\(\:{P}_{ne}\)), local buckling (\(\:{P}_{nl}\)), and distortional buckling (\(\:{P}_{nd}\)), as demonstrated in Eq. 1.
The equations for computing the strength for flexural buckling (\(\:{P}_{ne}\)) in AISI&AS/NZS46,47 are shown below:
According to the following formulae, the nominal strength for local buckling (\(\:{P}_{nl}\)) may be determined:
The nominal strength for distortional buckling (\(\:{P}_{nd}\)) can be determined according to the following formula:
where
Equations (2)–(8) involve the gross cross-sectional area represented as \(\:Ag\). \(\:{P}_{crl}\), \(\:{P}_{crd}\), and \(\:{P}_{cre}\) denote the elastic local, distortional, and overall buckling loads, respectively.
Developed design equations
As stated earlier, the FEA model established in this study calculates the axial strength of pin-ended CFS L columns with a high degree of precision. As a result, the results of the parametric study were used to recommend a new design equation in the form of a modified DSM rule for the strength of pin-ended CFS L columns.
The design equation for calculating the axial strength (Pdesign) of pin-ended CFS angle columns developed in this study is given below:
where
This equation is designed to provide a more accurate prediction of the axial strength by incorporating results derived from FEA, which capture the behavior of these columns under various loading conditions.
Application of the ML models
Extreme gradient boosting (XGB)
The development of XGB represents a major improvement in artificial intelligence methodologies. The driving force behind the creation of XGB was the need for a scalable tree boosting machine learning model48,49. The XGB algorithm is based on the decision tree, a popular supervised learning method introduced by Quinlan in 198650 for both classification and regression purposes. It incorporates a regularization term (\(\:\varOmega\:\)) into the differentiable loss function (\(\:L\)) to prevent overfitting and enhance computational performance, speed, and accuracy. It can be expressed below, and the structure of XGB is shown in Fig. 3 using Microsoft PowerPoint 2016.
Here, \(\:{f}_{m}\) represents the weak learner from each individual tree, \(\:\gamma\:\) denotes the minimum reduction in loss, and \(\:\lambda\:\) represents the regularization factor.
The weak learner is
Here, \(\:{g}_{i}\) is the gradient loss function, and \(\:{h}_{i}\) is the Hessian loss function, which is calculated by
Equation (4) can be simplified by eliminating the constant term shown below.
The weight of the \(\:{j}^{th}\) leaf, denoted as \(\:{W}_{j}\) in Eq. (7), can be revised using the optimal weights obtained through
Equation (7) is modified as follows:
Having a similarity score in the first term,
This function is used in the gain function, \(\:{L}_{gain}\), which is used to determine if branching is necessary.
The gain function is expressed as
where \(\:L\) and \(\:R\) are the left and right leaves, respectively, and the weak learners are updated in each leaf:
where \(\:{l}_{r}\) represents the learning rate and \(\:{\varphi\:}_{m}\) denotes the objective function being minimized, which is expressed as
The final combined learner and prediction are acquired by

Structure of XGB.
Adaptive boosting (AB)
AB is a boosting algorithm that strengthens a learner by linearly combining weak learners and adjusting sample weights through successive regression processes to account for errors in current predictions48,51. Boosting, as an ensemble method, enhances prediction performance by integrating multiple algorithms rather than relying on a single algorithm. The term “adaptive” in AB indicates its ability to quickly adjust to poorly predicted data and continuously learn predictive models in real time. The AB assigns higher weights to data with larger prediction errors, updating the learning data to better fit the model. Initially, as depicted in Fig. 4 using Microsoft PowerPoint 2016, AB begins with weak learners and iteratively updates them to address their deficiencies, using a varying measure of confidence (α) based on previous performance. The initial weights of the model are expressed below:
The weight varies with respect to the number of data points in the training data (i.e., (xi, yi) (i = 1, 2, …, n)). For M equal to one to m, the training process is repeated until the average loss described below is achieved.
Let \(\:{\beta\:}^{\left(m\right)}=\frac{\stackrel{-}{L}}{1-\stackrel{-}{L}}\) represent the confidence level of the weak learner. The updating weight of the data is
On the basis of the learned β(m), each stump is updated to reflect its significance. In this context, m and M denote the index and the total number of weak learners, respectively. The loss for each sample, Li, is then computed by
where \(\:{F}_{m}\left({x}_{i}\right)\) is the combined weak prediction. The loss function, L, is as follows:
Linear | \(\:{L}_{i}=\left[\frac{\left|{F}_{m}\left({x}_{i}\right)-{y}_{i}\right|}{D}\right]\:\) | (29) |
Square | \(\:{L}_{i}=\left[\frac{{\left|{F}_{m}\left({x}_{i}\right)-{y}_{i}\right|}^{2}}{{D}^{2}}\right]\:\) | (30) |
Exponential | \(\:{L}_{i}=1-exp\left[\frac{\left|{F}_{m}\left({x}_{i}\right)-{y}_{i}\right|}{D}\right]\:\) | (31) |
where \(\:D=sup\left|{F}_{m}\left({X}_{i}\right)-{y}_{i}\right|\). The final prediction, \(\:{F}_{M}\left(x\right)\), which results from combining M weak learners, can be represented as
where \(\:{F}_{m}\left(x\right)\) denotes the prediction made by \(\:{m}^{th}\) wesak learner for each input \(\:{x}_{i}\).

Structure of AB.
Categorical features boosting (CB)
CB is a nonlinear regression technique that employs ensemble learning. It builds on the gradient boosting decision tree (GBDT) framework, which was introduced in 201752. The CB model stands out from other models because of its exceptional ability to automatically manage the encoding of categorical features. GB algorithms often lead to overfitting. This overfitting occurs because the algorithm repeatedly uses the same data in each boosting iteration to reduce model errors, causing estimation deviations53,54,55,56. CB tackles the overfitting problem commonly associated with gradient boosting by incorporating two key techniques: ordered boosting and gradient-based one-hot encoding (GOHE). At its core, CB constructs an ensemble of decision trees in a sequential manner, where each tree learns from the errors made by its predecessors, and the structure of this booting is shown in Fig. 5.
The algorithm starts with model parameters \(\:M\), training data \(\:{\left({x}_{i},{y}_{i}\right)}_{i=\text{1,2},\dots\:n}\), a learning rate \(\:\alpha\:\), a loss function \(\:L\), and a specified feature order \(\:{\left\{{\sigma\:}_{i}\right\}}_{i=1}^{s}\). It also defines the boosting mode as either plain or ordered. The gradient of the loss function with respect to the model parameters is computed. This involves calculating gradients for each data point, which will guide how the model parameters should be adjusted. A feature is randomly selected for the current tree, which helps to ensure diversity in the model.
The gradient boosting process enhances the prediction of y through a function \(\:{F}^{t+1}\).
where \(\:{h}^{t+1}\)1 represents the base predictor. This predictor is chosen from a collection of functions \(\:H\) to minimize the loss function.
Using either the Taylor series expansion or the negative gradient descent method:
where\(- g^{t} \left( {x,y} \right):\left. {\frac{{\partial L\left( {y,~s} \right)}}{{\partial s}}} \right|_{{s = F^{t} \left( x \right)}} ~\)
However, gradient boosting faces two significant challenges: prediction shift and target leakage. In CB, the fundamental predictors are oblivious decision trees, which are also known as decision tables. The term “oblivious” indicates that the same splitting criterion is applied across an entire level of the tree, leading to a more balanced structure that is less susceptible to overfitting and much quicker during the testing phase. Additionally, CB uses an adaptation of the traditional gradient boosting algorithm known as ordered boosting to prevent prediction shifts and target leakage. This enhances the model’s generalization capabilities, leading to superior performance compared with the leading gradient boosted decision tree implementations such as LightGBM. Furthermore, CB includes the automatic handling and processing of categorical features. To optimize the performance of a CB model, it is crucial to carefully identify and set the relevant hyperparameters before the learning process begins.
After the training algorithm is selected, the fine-tuning phase focuses on identifying the optimal training parameters and the best model structure. The first critical parameter to define is the number of iterations, indicating the maximum number of trees that can be constructed to address the given machine learning problem. Another essential parameter is the maximum depth, which specifies the maximum number of splits in each tree. This value must be carefully chosen: a low maximum depth allows for quick but potentially inaccurate modeling, whereas a high maximum depth might yield a more accurate model but risks overfitting.
To address overfitting, training, validation, and test subsamples were randomly selected, and a 5-fold cross-validation technique was employed. An overfitting detection method was also implemented to halt training if overfitting was detected. Before each new tree is built, the CB algorithm checks how many iterations have passed since the optimal loss function value was achieved. If this number surpasses the set limit for the overfitting detector, training stops. The default threshold for this detector is set at 20 iterations.
Finally, the learning rate, which adjusts the gradient step size during training, must be fine-tuned. The optimal set of hyperparameters was determined on the basis of the loss function value.

Structure of CB.
Random forest (RF)
The random forest operates by generating multiple decision trees during the training process. Each tree is built using a randomly selected subset of the dataset and evaluates a random subset of features at each split. This randomness injects diversity into the trees, which helps minimize overfitting and enhances the model’s predictive accuracy. Bagging, introduced by Breiman in 199657, was the initial step in the development of random forest. Later, in 2001, Breiman58 expanded on this concept by incorporating a random selection of features, thus defining the random forest algorithm. In prediction, the algorithm combines the outputs of all trees, uses voting for classification tasks and averages for regression tasks. This collective decision-making process, which draws on insights from multiple trees, leads to stable and accurate results. Random forests are popular for classification and regression because they handle complex data well, mitigate overfitting, and deliver reliable predictions in various scenarios59,60,61.
First, the process involves selecting a subset of data points from the training set. This is achieved by randomly choosing \(\:K\) data points to form the initial subset. Once this subset is established, decision trees are constructed on the basis of these selected data points, creating a series of decision trees tailored to these specific subsets. Next, a predetermined number \(\:N\) is chosen, indicating how many decision trees will be built in total. The procedure of selecting random subsets and constructing decision trees is then repeated to generate multiple trees. In regard to classifying new data points, each decision tree independently provides a prediction. The new data points are ultimately categorized on the basis of the majority vote from all the decision trees, with the category receiving the highest number of votes being assigned to the data points.
The random forest algorithm harnesses the strength of ensemble learning through the creation of multiple decision trees. Each tree in the ensemble acts as a distinct expert, focusing on different facets of the data. By having these trees work independently of one another, the random forest reduces the chance of the overall model being swayed by the peculiarities of any single tree. To guarantee that every decision tree in the ensemble contributes a distinct viewpoint, the random forest algorithm uses random feature selection. When training each tree, a random subset of features is selected. This randomness allows each tree to concentrate on different elements of the data, promoting diversity among the predictors within the ensemble. Bagging, or bootstrap aggregating, is a fundamental method used in training random forest models. It involves generating several bootstrap samples from the original dataset, where instances are sampled with replacement. Each decision tree in the random forest is trained on a different subset of the data, leading to increased diversity among the trees and enhancing the overall robustness of the model. In prediction tasks, each decision tree within a random forest contributes its vote. For regression problems, the final prediction is obtained by averaging the predictions from all the trees. The random forest structure is shown in Fig. 6.

Structure of RF.
Hyperparameters for the ML models
In this study, an array of machine learning models were meticulously optimized by exploring specific search spaces for their hyperparameters, enabling the selection of the most effective configurations. The RF model emerged as the top performer, achieving optimal results with 110 estimators, no constraints on maximum depth, minimum samples split of 2, and ‘auto’ for max features, indicating a balanced approach to feature selection. The XGB model was fine-tuned to utilize ‘sqrt’ for max features, a max depth of 5, and a learning rate of 0.3, with 100 estimators, a minimum weight of 5, gamma = 0, a subsample ratio of 0.9, a Col sample by tree of 0.8, a regression alpha of 0.1, and a regression lambda of 10, highlighting a sophisticated balance between model complexity and regularization. The AdaBoost model was found to be most effective with 150 estimators and a learning rate of 0.3, reflecting its reliance on iterative boosting for enhanced performance. Finally, the CB model, known for its robustness in handling categorical features, was optimized by selecting a RF as its base estimator. The model was further fine-tuned with 1000 iterations, a learning rate of 0.1, a maximum depth of 4, and an optimized leaf regularization value. This careful tuning of each model underscores the importance of hyperparameter optimization in achieving superior predictive accuracy and model performance.
Data Preparation and preprocessing for the ML models
The models require a sufficient amount of relevant and high-quality data to learn patterns and make accurate predictions. The data are obtained from Table 4, which contains input and output data for estimating the capacity of the CFS columns. In total, 110 data points with inputs are leg size, thickness, slenderness ratio, and yield strength, whereas the data outputs are load capacity (DSM). Normalizing the inputs and output variables in machine learning methods is indeed fundamental for enhancing model accuracy. Normalization (\(\:\text{N}\)) techniques vary depending on the context and the specific requirements of the data62,63,64. Min–max normalization scales the data to a fixed range, normally among \(\:\left[\text{0,1}\right]\). The expression for min–max normalization is given in Eq. (36). Then, to train and test the model, the normalized data are divided into training data with 77 data points (70%) and testing data with 33 data points (30%).
where N is the normalized value and A is the actual value.
The Pearson correlation coefficient and pair plot of the dataset are shown in Fig. 7, and the results of the statistical analyses are also shown in Table 3.

Pearson pairs plot.
SHapley additive explanations (SHAP)
SHapley additive exPlanations (SHAP) is a method used to interpret and understand the output by assigning each feature an SHAP value. This value represents the contribution of a feature to a specific output. SHAP values ensure that feature contributions are fairly and consistently allocated to the overall output. By using SHAP, practitioners can gain a clear, interpretable view of feature importance and the relationships between input features and outputs65,66.
In this section, the data are analyzed to study the impact of the input and output variables. This SHAP plot visually represents (Fig. 8) the impact of different features on the output of the data. The x-axis shows the SHAP values, indicating the extent to which each feature influences the model’s predictions, with positive values increasing the prediction and negative values decreasing it. The y-axis lists the features, labeled \(\:t\), \(\:\lambda\:\), \(\:{f}_{y},\) and \(\:L\), with each feature’s impact depicted as a cloud of points. The color of these points represents the feature’s original value, ranging from blue (low values) to red (high values). This plot reveals that features such as \(\:\lambda\:\) and \(\:t\) have a significant influence on the model’s predictions, as indicated by the widespread of SHAP values. It also shows how higher or lower feature values contribute to increasing or decreasing the model’s output. Overall, the plot provides a clear and comprehensive understanding of feature importance and the nature of its influence on the model’s decisions.

SHAP analysis plot.
This bar chart represents (Fig. 9) the mean absolute SHAP values for each feature, showing their overall importance in the model. The x-axis indicates the mean of the absolute SHAP values, which quantifies the average impact of each feature on the model’s predictions, regardless of direction (positive or negative). The y-axis lists the features, labeled t, λ, \(\:{f}_{y}\), and L. The chart clearly shows that the features \(\:t\) and \(\:\lambda\:\) have the highest importance, with mean SHAP values of 13.85 and 10.85, respectively. These features have the most significant influence on the model’s predictions. The feature \(\:{f}_{y}\) is less important, with a mean SHAP value of 1.98, whereas \(\:L\) has a minimal impact, with a mean SHAP value of only 0.29. This chart provides straightforward visualization of feature importance, highlighting which variables contribute the most to the model’s decision-making process.

SHAP value in bar chart.
Evaluation of models using performance parameters
The parameters are used to evaluate the performance and quality of the developed algorithm. These metrics are derived from statistical calculations. The coefficient of determination (R2)67, root mean square error (RMSE)68, performance index (PI), variance account factor (VAF), mean absolute error (MAE), mean absolute percentage error (MAPE), standard deviation ratio (SD), Theil’s inequality coefficient (TIC)69 and index of agreement (IA) are all used70,71,72.
In this context, \(\:{d}_{i}\) represents the observed value for the \(\:{i}^{th}\) data point, \(\:{y}_{i}\) represents the predicted value for the same data point, \(\:{d}_{mean}\) represents the mean value of the actual data, and \(\:N\) represents the total number of data samples. The performance assessment of the models was conducted via Eqs. (37)–(45), and the results were juxtaposed against the ideal values in Tables 6 and 7. Table 6 presents a comparison between the training and testing outcomes of the ensemble models.
Results and discussion
Discussion of the FEM results
Variation in the geometrical parameters
The results of the parametric research are shown in Table 4, which also includes the failure modes and PANSYS values (in kN) for several samples subjected to different slenderness ratios. The PANSYS scores frequently decrease for all the samples as the slenderness ratio increases, suggesting a decrease in the load-bearing capacity. The failure modes also change as the slenderness ratio increases. At lower ratios, torsional buckling (T) is first observed, followed by a combination of torsional and flexural buckling (T + F), and at higher ratios, flexural buckling (F) alone. This pattern illustrates how crucial slenderness is for both structural stability and failure mode; larger ratios result in more complicated buckling interactions, whereas lower ratios promote local or distortional buckling. The differentiation among the buckling types (local, distortional, torsional, and flexural) highlights the intricate interaction between material qualities and geometry in ascertaining the overall failure process.
Influences of column slenderness (λ) on strength
To explore the influence of column slenderness on the strength of CFS L columns, the column slenderness (λ) was varied from 20 to 120. The failure modes of the columns with dissimilar lengths are summarized in Table 4, and the failure modes of the typical columns are shown in Fig. 10. Table 4 shows that the columns with slenderness ratios lower than 40 mainly failed by local buckling (LF) and distortional buckling (DF). The intermediate columns with slenderness values less than 100 failed at the interface of torsional buckling (TF) and flexural buckling (FF). On the other hand, the slender columns with a slenderness higher than 100 mainly exhibited LF and FF failure.

Deformed shapes for specimens with different column slenderness.
Table 4 shows the variation in the strength of the CFS L columns. The table clearly shows that as the column slenderness (λ) increased from 20 to 120, the strength decreased. To provide a clearer picture, the average strength decrease was approximately 36.55% for columns with lower slenderness (λ) values, specifically when the slenderness increased from 20 to 40. For columns with intermediate slenderness, the average axial strength decreased by approximately 50.21% as the slenderness (λ) increased from 50 to 80. Similarly, for the slender columns, the average axial strength decreased by approximately 8.15% when the slenderness (λ) increased from 90 to 120 in the case of the CFS L columns.
Effect of the section thickness (t) on the axial strength
Figure 11 displays the influence of the section thickness (t) on the axial strength. For example, when the section thickness was altered from 1 to 3 mm, the axial strength increased. Figure 11; Table 4 confirm that the percentages of improvement in the axial strength are 302%, 330% and 400%, respectively, for the columns with yield stresses of 270, 304 and 500 MPa.

Influences of section thickness on the strength of columns belonging to A80-λ-F series; (a) A80-F270; (b) A80-F304; (c) A80-F500.
Effect of yield stress (\(\:{f}_{y}\)) on strength
The influence of yield stress (\(\:{f}_{y}\)) on the strength of CFS L columns was also examined, and the results (PANSYS) are presented in Table 4; Figs. 12 and 13. As shown in Fig. 10, the variation in the FEA results with respect to column slenderness is obvious when the column slenderness is less than 50. However, when the column slenderness was greater than 50, there was little difference between the FEA results of intermediate and slender columns with varying yield stresses (270, 304 and 500 MPa). Figure 13 presents the axial strength versus displacement plots for column A80-T3-λ20-F. Up to the prebuckling stage, no stiffness or strength variation was observed, whereas after the post buckling phase, the variation in stiffness and strength was noticeable.

Influence of yield stress on the strength of columns belonging to A80-T2-F series.

Load-end shortening plots for the columns belonging to A80-T3-λ20-F series.
Discussion of results from DSM
The calculation exactness of the suggested equation was related to the FEA results, the results available in the literature9,16 and the calculations of the current design DSM design rules. Figure 14; Table 4 show that the suggested axial strength is identical to the FEA results, which verifies the exactness of the design calculation proposed in the current study. Additionally, the prediction accuracy of the proposed equation is greater than that of the design rules of the DSM.

Evaluation of strengths acquired from the FEA, current DSM and the proposed equation.
The results of finite element analysis (FEA) are contrasted in Table 5 with the DSM strengths and a suggested design equation. The table compares the ratios of FEA-predicted strengths to those determined by the DSM and the suggested design technique, evaluating various samples with differing slenderness ratios. The mean and coefficient of variation (COV) for the whole dataset are computed and shown for each slenderness ratio. The ratios in the \(\:\left(\frac{{P}_{ANSYS}}{{P}_{DSM}}\right)\) section have a mean of 1.10, a COV of 0.21, and a range of 0.69–1.55. This suggests that, with moderate variability, the FEA values are often greater than those estimated by the DSM. The \(\:\left(\frac{{P}_{ANSYS}}{{P}_{DSM}}\right)\) section, on the other hand, demonstrates a closer match between the suggested design equation and the FEA results, with ratios ranging from 0.81 to 1.21, a mean of 1.01, and a lower COV of 0.11. This suggests that the proposed design equation provides a more consistent and accurate prediction of the strengths than does the DSM. The lower COV also implies that the proposed design method has less variability and offers more reliable results across different slenderness ratios.
Comparative analysis of machine learning models
When the performances of different machine learning models, XGB, AB, RF, and CB, on training (TR) and test (TS) data across multiple metrics are compared in Table 6, XGB consistently ranks the highest. XGB achieves the best R2 scores (0.9927 TR, 0.9584 TS), indicating the strongest fit and prediction accuracy. Similarly, XGB’s RMSE values (0.0197 TR, 0.0432 TS) indicate that it has the lowest error rates among the models. The VAF and PI for XGB further underscore its superior performance, with values closest to the ideal values. Conversely, AB ranks the lowest, showing the least favorable results, with higher RMSE values (0.0381 TR, 0.0692 TS) and lower R2 values (0.9739 TR, 0.8955 TS). RF and CB fall in between, with RF performing slightly better than CB. CB’s results (0.9787 TR, 0.9359 TS for R2; 0.0342 TR, 0.0527 TS for RMSE) are closer to those of RF but still not as impressive as those of XGB. Across all the metrics, XGB consistently holds the top rank (1) on both the training and test data, whereas AB holds the lowest rank (4), making XGB the most likely candidate for the highest overall performance, followed by RF, CB, and AB.
Figure 15 presents eight scatter plots comparing the actual and predicted values for various models (XGB, AB, RF, CB) trained on two different datasets (TS and TR). Each plot displays a linear regression line \(\:(y\:=\:mx+b)\) and its corresponding R-squared value, indicating the goodness of fit. Compared with (e-h), plots (a-d) generally present stronger correlations with higher R-squared values. The XGB and RF models tend to outperform AB and CB in terms of prediction accuracy, as evidenced by their steeper slopes and higher R-squared values.
The provided Taylor diagrams (Fig. 16) compare the performance of five different models (XGB, AB, RF, CB, and DSM) in predicting two sets of data, likely related to the training and testing phases. The diagram shows the standard deviation of the model’s predictions against the correlation between the model’s predictions and the reference data. In both the training and testing phases, the XGB model has the highest correlation with the reference data, as indicated by its proximity to the DSM. However, it also displays a relatively high standard deviation, suggesting that its predictions are quite variable. Compared with AB, the RF model CB appears to offer a balance between correlation and standard deviation, positioning them closer to the optimal region of the diagram.

Actual vs. prediction (training and testing); (a) XGB – Training; (b) AB – Training; (c) RF – Training; (d) CB – Training; (e) XGB – Testing; (f) AB – Testing; (g) RF – Testing; (h) CB – Testing.

Taylor diagram for training and testing; (a) training data; (b) testing data.
External model validation (minimum data)
External validation ensures a model’s generalizability by comparing predictions with observed outcomes. Golbraikh and Tropsha73 introduced strict statistical criteria to assess reliability, preventing overfitting. Their method enhances model credibility, especially for small datasets, ensuring robustness and real-world applicability by distinguishing genuine predictive power from chance correlations74. For a model to be considered 100% accurate, its correlation coefficient (R2) must have an ideal value of 1. The regression line passes through the origin and has a slope of close to 1, which suggests that the approximate values correspond to the average values. This usually means that the model is well trained, which means that there is no systematic bias in predictions. However, what is trained on the prediction can achieve separate gradients unless errors are symmetrical. In an ideal model with correct predictions, both registers should give a slope (\(\:k\:and\:k{\prime\:}\)) of 1. It may indicate issues such as inequality (non-existent variance).
The model’s result (Table 7) meets the eight required conditions, which demonstrates their reliability. Excellent predictive ability as their correlation coefficients \(\:\left(R\right)\) exceeds 0.9 while XGB leads with an R value of 0.9790, followed by RF at 0.9706 and CB at 0.9674. The slope parameters \(\:\left(k\:and\:k{\prime\:}\right)\) of all models validate proportional prediction accuracy between 0.85 and 1.15. The RF (0.9949) and CB (0.9953) show the best performances regarding goodness-of-fit measurements \(\:\left({R}_{o}^{{\prime\:}2}\:and\:{R}_{o}^{{\prime\:}{\prime\:}2}\right)\) as they approach a value of one while all models remain within this range. According to the robustness examination, XGB achieves a \(\:{R}_{m}\) value of 0.7874, while RF and CB attain 0.7259 and 0.7079, respectively. However, AB has a value of 0.6335, indicating lesser stability. In the error \(\:\left(m\:and\:n\right)\) values within the specified range \(\:\left(\right|m|,\:|n|\:<\:0.1),\) AB demonstrates the highest deviation indicating potential bias. The XGB model is the best predictor based on its superior correlation, robust performance, and minimal error margin, making it the most reliable selection for future estimation.
Comparisons of the proposed machine learning models, FEM, and developed design equations
The results for the various models XGB, AB, RF, CB, FEM, and DESIGN demonstrate (Table 8) distinct performance characteristics across different metrics compared with the ideal values. In this comparison, a combined dataset is used (training and testing) because there are no training or test datasets for the FEM and proposed design rules.
The XGB model shows impressive accuracy, with a \(\:{R}^{2}\:\) value of 0.9835, indicating a strong fit to the data. It also has a low RMSE of 0.0288, suggesting minimal error in predictions. Its VAF of 98.35% further supports its high accuracy. The XGB model also performs well in terms of the MAPE (6.1498), indicating a relatively low average prediction error. However, its PI is 1.9375, which is slightly higher than ideal. On the downside, the model’s TIC and IA are greater than those of DSIGN, suggesting some trade-offs in model complexity and accuracy. AB performs well but lags slightly behind XGB, with an \(\:{R}^{2}\) of 0.9535 and a higher RMSE of 0.0495. While it shows reasonable performance in VAF (95.32%), its higher MAPE (12.6526) reflects a larger average prediction error. Compared with XGB, AB also results in a better PI, but it has a less favorable TIC and IA. RF and CB show comparable performances, with RF having a slightly higher \(\:{R}^{2}\:\) of 0.9772 than CB’s 0.9675 and a lower RMSE of 0.0344 versus CB’s 0.0406. Both models have strong VAFs (RF: 97.72%, CB: 96.74%) and acceptable MAPEs. However, the TIC and IA values of RF are greater than those of CB, suggesting that while RF may provide a slightly better fit, it is potentially more complex. The FEM and DSIGN exhibit lower performances across most metrics. FEM, with an \(\:{R}^{2}\) of 0.9215 and a higher RMSE of 0.0752, falls short of the ideal values in most areas, particularly with a high MAPE of 25.3629. Despite having the best TIC and IA values, DSIGN has a significantly lower \(\:{R}^{2}\:\) of 0.9998, indicating almost perfect fitting but also a high VAF of 99.98%, which is ideal, although the MAPE is relatively high. Overall, XGB stands out for its superior accuracy and lower error metrics, whereas DESIGN, despite its close to ideal TIC and IA values, does not perform as well in terms of MAPE. Circular bar charts (Fig. 17) are shown. are employed to illustrate the distribution of each metric across the different models. The relative sizes of the sectors within each chart offer a quick visual assessment of model performance for each metric. Additionally, numerical values are included for precise comparison. This graphical representation facilitates the efficient identification of top-performing models for specific evaluation criteria.

Graphical view of performance metrics.
Figure 18 displays a series of scatter plots comparing the predicted and actual values, which are likely related to a performance metric. Each scatter plot represents a different model (XGB, AB, RF, CB, FEM, Design), as indicated by labels (a) to (f). The plots visualize the model’s predictive accuracy, with the closer the points are to the diagonal line \(\:(y=x)\), the better the model’s performance. Additionally, each plot includes a linear regression line \(\:(y=mx+b)\) and an R². The regression line represents the model’s best fit to the data, whereas R² indicates the proportion of variance in the dependent variable explained by the independent variable. Higher R² values suggest a better fit. Overall, the image provides a visual comparison of the predictive capabilities of six different models on the basis of their scatter plots, regression lines, and R-squared values.

Scatter plots for ML with FEM and design rule; (a) XGB (overall); (b) AB (overall); (c) RF (overall); (d) CB (overall); (e) FEM (Overall); (f) Design rule.
Figure 19 provides an overview of the performance of different models across various evaluation metrics (R², RMSE, VAL, PI, MAPE, the SD ratio, TIC, and IA). The color-coded heatmap visually represents the accuracy levels, with darker shades of blue indicating higher accuracy scores. Most models exhibit strong performance across multiple metrics, with many scores clustering in the darker blue range (96–100%), suggesting that the models are generally accurate in their predictions. However, there are variations in performance across different models and metrics. For example, the “DESIGN” model consistently achieves perfect scores (100%) across all the metrics, indicating exceptional accuracy. In contrast, the “FEM” model yields lower scores for several metrics, such as the MAPE and SD ratio, suggesting potential areas for improvement. Different metrics provide insights into different aspects of model accuracy. For example, R² and PI measure model fit and classification accuracy, respectively, whereas RMSE and MAPE assess prediction error. Analyzing the performance across these metrics can help identify the strengths and weaknesses of each model. Notably, the XGB and RF models demonstrate strong performance across most metrics, particularly in terms of R², PI, and RMSE, suggesting their effectiveness in both regression and classification tasks. As mentioned earlier, the DESIGN model stands out with consistently perfect scores, indicating exceptional predictive power. While generally accurate, the FEM model could benefit from further refinement, especially concerning prediction error as measured by the MAPE and SD ratio. The accuracy of these models is likely influenced by the quality and quantity of the data used for training. More complex models (such as XGB) might offer higher accuracy but could also be more prone to overfitting. The optimal model for a particular application depends on the specific requirements and priorities for accuracy, interpretability, and computational efficiency.

Accuracy analysis.
The provided error analysis plots (Fig. 20) illustrate the performance of various models (XGB, AB, RF, CB, FEM, and DESIGN) in predicting a certain outcome across different data orders. Overall, the plots reveal varying degrees of error patterns among the models. XGB and RF exhibit relatively lower errors with some fluctuations, whereas AB and CB show more pronounced oscillations and higher error magnitudes. The FEM results in a distinct pattern with larger error peaks, and DESIGN results in the lowest error but consistent oscillatory behavior. These findings suggest that the predictive capabilities of the models vary significantly, and further analysis is needed to understand the reasons behind these differences and identify the most suitable model for the given task. Each model error is represented by a box plot illustrating the spread of error values. XGB has the highest maximum error at 0.1293 and a minimum error of -0.0565, with the average error falling between these extremes. AB has a similar range of errors to that of XGB, with a maximum error of 0.2016 and a minimum of -0.0480, and its average error also lies between these points. Compared with XGB and AB, RF has a relatively lower maximum error of 0.1615, but its minimum error of -0.0630 is slightly lower, with an average error within this range. CB presents a distribution with a maximum error of 0.2058, close to the highest value observed, and a minimum error of -0.0618, with the average error positioned between these two points. The FEM has a maximum error of 0.2049, which is comparable to that of CB, and a minimum error of -0.0394, with the average error residing within this interval. DESIGN displays the lowest maximum error among all the models at 0.0431 and a minimum error of -0.0066, indicating a narrower range of errors compared with the other models, with the average error positioned within this smaller range. In terms of the maximum error, CB and FEM exhibit the highest values, followed closely by AB and XGB, whereas DESIGN has the lowest maximum error. In terms of the minimum error, RF and CB have the lowest values, whereas DESIGN has the highest minimum error among the models. Importantly, while these box plots provide insights into the error distribution, they do not reveal the specific values of the average errors for each model. A more comprehensive analysis would require calculating these averages to gain a deeper understanding of the models’ performance.

Error analysis with plot; (a) XGB (Overall); (b) AB (Overall); (c) RF (Overall); (d) CB (Overall); (d) CB (Overall); (e) FEM; (f) Design rule.
The Taylor diagram75 (Fig. 21) is a graphical tool that is used to compare the performance of different models. It is a polar plot that shows the relationship between the standard deviation (SD) and correlation coefficient (R) of the model predictions with the observations. The SD is plotted on the radial axis, and R is plotted on the angular axis. The closer a model is to the origin, the better its performance. In this Taylor diagram, the XGB, AB, RF, CB, FEM, and DESIGN models are compared. The XGB model has the highest SD and the lowest R, which means that it is the most inaccurate model. The DESIGN model has the lowest SD and the highest R, which means that it is the most accurate model. The other models fall between these two extremes. The AB, RF, and CB models have similar SDs and Rs values, which means that they have similar performances. The FEM model has higher SDs and lower R values than the AB, RF, and CB models do, which means that the former are less accurate. Overall, the DESIGN equation is the best performing model, followed by the XGB, AB, RF, and CB models. The FEM model is the least accurate model.

Taylor diagram.
Discussion of the results
The finite element analysis (FEA) conducted in this study utilized ANSYS to refine a model specifically for pin-ended cold-formed steel (CFS) L-columns under axial compression, employing Shell181 elements known for their ability to model complex interactions and deformations in thin-shell structures. The optimal mesh size of 25 mm² was determined to balance accuracy and computational efficiency. The material properties were modeled via elastic‒plastic assumptions, with four different yield stresses (304.5, 270, 304, and 500 MPa). Boundary conditions simulated pin-ended supports by constraining flexural and torsional displacements and rotations. Initial geometric imperfections were considered, whereas residual stresses were excluded, on the basis of the findings in the literature that their combined effects on the CFS L-columns’ capacity and buckling behavior are minimal. The FE model was validated against experimental data from Cruz et al. (2015) and Landesmann et al. (2017), which revealed a strong correlation (PEXP/PANSYS ratio of 0.99 and COV of 0.06), indicating high accuracy in predicting the strength of CFS L-columns. A detailed parametric study was then conducted to explore the influence of variables such as the vertical and horizontal leg width, section thickness, yield stress, and column slenderness ratio on the axial strength. The study revealed that columns with a slenderness ratio below 40 typically fail by local and distortional buckling, whereas those with intermediate slenderness (up to 100) experience torsional and flexural buckling, and slender columns (above 100) predominantly fail by local and flexural buckling. Increasing the section thickness from 1 to 3 mm led to significant increases in axial strength, by up to 400%, depending on the yield stress. The yield stress had a marked effect on the strength variation, particularly in columns with a slenderness ratio less than 50. The study also evaluated the accuracy of current design rules (AISI, AS/NZS) and proposed a new design equation for the axial strength of pin-ended CFS L-columns, which showed superior accuracy compared with existing methods. Finally, machine learning models were compared, with XGB showing the highest accuracy and lowest error rates, outperforming the AB, RF, and CB models in predicting column strengths. This comprehensive study enhances the understanding of the structural behavior of CFS L-columns and provides improved predictive models and design equations for practical applications.
When machine learning models (XGB, AB, RF, CB) are compared on training (TR) and test (TS) data, XGB consistently performs the best. XGB achieves the highest R² scores (0.9927 TR, 0.9584 TS) and the lowest RMSE values (0.0197 TR, 0.0432 TS), indicating strong predictive accuracy. The VAF and PI for XGB also have values closest to the ideal values, whereas AB ranks the lowest, with higher RMSE values (0.0381 TR, 0.0692 TS) and lower R² scores (0.9739 TR, 0.8955 TS). RF and CB fall in between, with RF outperforming CB slightly. The Taylor diagrams indicate XGB’s high correlation with the reference data but also a higher standard deviation, suggesting variability. Compared with AB, RF and CB strike a balance between correlation and standard deviation, positioning them closer to the optimal region. Compared with the FEM and developed design equations, XGB remains superior, with an R² of 0.9835 and a low RMSE of 0.0288. The design rule, despite showing perfect TIC and IA values, has a higher MAPE. Graphical analysis, including scatter plots and Taylor diagrams, highlights XGB’s predictive power, whereas error analysis reveals variability in performance across models, with XGB and RF showing lower errors than AB and CB. Overall, among the machine learning models, XGB is the top performer across most metrics, followed by RF, CB, and AB. The FEM shows lower performance; the FEM has high error metrics, whereas DESIGN, despite nearly perfect fitting (R² 0.9998), presents a high MAPE compared with XGB. Graphical analyses highlight XGB’s superior accuracy, whereas DSIGN excels in terms of the TIC and IA.
However, when the datasets are small, accuracy may fluctuate, and the model might be sensitive to overfitting. XGB often performs better because it is excellent at working with small data by regularizing and boosting it. RF and CB also effectively use ensemble learning to minimize variance. However, developed models may be particularly problematic with small dataset of different problem statement, as the model performance is highly influenced by missing data value, noise and outliers in dataset. In present study, the collected dataset has no such kind of missing data, noise and outlies detected. All models satisfy the evaluation criteria; however, XGB has the highest values of \(\:{R}^{2}\) and standard deviations and the least RMSE, indicating robustness even for small data sets.
Conclusion
This research provides the outcomes of FEA of pin-ended CFS L columns subjected to centriole compression. The FE models established in this study were confirmed in addition to the experimental results offered in the literature. With the confirmed FE models, a parametric study comprising a total of 110 FE models was conducted to examine the effects of various parameters on the axial capacity of pin-ended CFS L columns. The impacts of column slenderness, section thickness and yield stress on the strength of such pin-ended CFS L columns were considered in the parametric study. On the basis of the results of the FE models, a novel design equation was developed to attain the axial load of pin-ended CFS L columns subjected to axial compression. A comparison against the FEA results was then conducted, which revealed that the developed design equation can be used to calculate the compression strength of such pin-ended CFS L columns carefully. Additionally, the proposed machine learning model (XGB, AB, RF, and CB) for load prediction uses data from a parametric study. In conclusion, the comparative analysis of the machine learning models (XGB, AB, RF, CB), FEM, and developed design equations reveals distinct performance characteristics across various metrics. The XGB model demonstrates superior accuracy, with an R² of 0.9835 and a low RMSE of 0.0288, making it highly effective in predictions. However, the DSIGN, despite its perfect fit (R² = 0.9998) and ideal TIC and IA values, has a higher MAPE, indicating a larger average prediction error. AB, RF, and CB perform well but are slightly behind XGB. The FEM exhibits lower performance overall. Circular bar charts and scatter plots effectively illustrate these differences, aiding in model selection on the basis of specific evaluation criteria. Future applications should consider XGB for scenarios requiring high precision and accuracy. Although DESIGN shows near-ideal values in some metrics, its overall performance is limited by higher error measures (MAPE). Thus, XGB is recommended for optimal results, especially when accuracy is paramount. The detailed analyses, encompassing diverse evaluation criteria and visual representations, provide a robust basis for selecting and understanding the strengths of these models in the context of the presented dataset. Large amounts of data are needed for ML prediction but not for other models. Importantly, however, predicting the future is inherently uncertain, and these considerations are based on current trends and observations. ML is a rapidly evolving field, and new developments and challenges may emerge that could shape its future in unexpected ways.
The machine learning models, especially XGB, are sensitive to overfitting or underfitting when applied to datasets with various characteristics since they mostly depend on the quantity and quality of data from the parametric study. Furthermore, engineers who need to understand fundamental mechanics face difficulties due to the complexity and interpretability of machine learning models such as XGB, AB, RF, and CB. The utilization of FEA and machine learning techniques in normal design processes may be restricted because of their significant computational resource requirements.
Future research should concentrate on developing and validating the design equation for a wider variety of column geometries. Furthermore, to better manage complicated datasets, investigating more recent machine learning approaches would be beneficial. Practical use would be encouraged by creating user-friendly tools that incorporate machine learning models and design equations into easily accessible platforms. Finally, examining these columns’ long-term performance under various loading scenarios might guarantee the validity and dependability of the suggested models and equations under practical conditions.
Data availability
The datasets used and/or analyzed during the current study are available from the corresponding author upon reasonable request.
References
Poologanathan, K., Perampalam, G., Gunalan, S. & Corradi, M. Structural Performance of Cold-Formed Steel (CFS) Structures. Buildings 13, 1689 (2023).
Leng, J., Li, Z., Guest, J. K. & Schafer, B. W. Shape optimization of cold-formed steel columns with fabrication and geometric end-use constraints. Thin-Walled Struct. 85, 271–290 (2014).
Degtyarev, V. V. & Degtyareva, N. V. Numerical simulations on cold-formed steel channels with flat slotted webs in shear. Part II: ultimate shear strength. Thin-Walled Struct. 119, 211–223 (2017).
Peköz, T. Development of a unified approach to the design of cold-formed steel members. (1986).
Popovic, D., Hancock, G. J. & Rasmussen, K. J. R. Axial compression tests of cold-formed angles. J. Struct. Eng. 125, 515–523 (1999).
Popovic, D., Hancock, G. J. & Rasmussen, K. J. R. Compression tests on cold-formed angles loaded parallel with a leg. J. Struct. Eng. 127, 600–607 (2001).
Young, B. Tests and design of fixed-ended cold-formed steel plain angle columns. J. Struct. Eng. 130, 1931–1940 (2004).
Rasmussen, K. J. Design of angle columns with locally unstable legs. J. Struct. Eng. 131, 1553–1560 (2005).
Cruz, R. Experimental analysis and design of slender pin-ended cold-formed steel equal-leg angle columns. M.A.Sc. Thesis Struct. Eng. COPPE, Fed. Univ. Rio Janeiro (2015).
Dinis, P. B. & Camotim, D. A novel DSM-based approach for the rational design of fixed-ended and pin-ended short-to-intermediate thin-walled angle columns. Thin-Walled Struct. 87, 158–182 (2015).
Silvestre, N., Dinis, P. B. & Camotim, D. Developments on the design of cold-formed steel angles. J. Struct. Eng. 139, 680–694 (2013).
Zhang, L., Tan, K. H. & Zhao, O. Experimental and numerical studies of fixed-ended cold-formed stainless steel equal-leg angle section columns. Eng. Struct. 184, 134–144 (2019).
Natesan, V. & Madhavan, M. Experimental study on ultimate strength of bolted L shaped sleeve joints between CFS lipped channel sections. J. Constr. Steel Res. 169, 106022 (2020).
Ananthi, G. B. G., Deepak, M. S., Roy, K. & Lim, J. B. P. Influence of intermediate stiffeners on the axial capacity of cold-formed steel back-to-back built-up unequal angle sections. Structures 32, 827–848 (2021).
Wang, X., Jiang, J., Liu, Y. & Chen, Z. Eccentric compression behavior of L-shaped column fabricated by thin-walled square steel tubes based on self-drilling screw connections. Thin-Walled Struct. 202, 112063 (2024).
Landesmann, A., Camotim, D., Dinis, P. B. & Cruz, R. Short-to-intermediate slender pin-ended cold-formed steel equal-leg angle columns: experimental investigation, numerical simulations and DSM design. Eng. Struct. 132, 471–493 (2017).
Hakkal, S. & Lahcen, A. A. XGBoost to enhance learner performance prediction. Comput. Educ. Artif. Intell. 7, 100254 (2024).
Ali, Z. A., Abduljabbar, Z. H., Taher, H. A., Sallow, A. B. & Almufti, S. M. Exploring the power of eXtreme gradient boosting algorithm in machine learning: A review. Acad. J. Nawroz Univ. 12, 320–334 (2023).
Xing, H. J., Liu, W. T. & Wang, X. Z. Bounded exponential loss function based adaboost ensemble of OCSVMs. Pattern Recognit. 148, 110191 (2024).
Xu, J., Wu, Q., Zhang, J. & Tang, Z. Exploiting universum data in adaboost using gradient descent. Image Vis. Comput. 32, 550–557 (2014).
Khalifa, F. A., Abdelkader, H. M. & Elsaid, A. H. An analysis of ensemble pruning methods under the explanation of random forest. Inf. Syst. 120, 102310 (2024).
Schlenger, J., Random & Forest Comput. Sci. Sport https://doi.org/10.1007/978-3-662-68313-2_24. (2024).
Breiman, L. Random forests. in Machine Learning (ed Schapire, R. E.) vol. 45 5–32 (Kluwer Academic., Netherlands, (2001).
Hancock, J. T. & Khoshgoftaar, T. M. CatBoost for big data: an interdisciplinary review. J. Big Data 7, (2020).
Dinis, P. B., Camotim, D. & Silvestre, N. FEM-based analysis of the local-plate/distortional mode interaction in cold-formed steel lipped channel columns. Comput. Struct. 85, 1461–1474 (2007).
Manikandan, P., Pradeep, T. & Arun, N. Effect of lateral bracing on resistance of intermediate Thin-Walled open column. Arab. J. Sci. Eng. 42, 1243–1250 (2017).
Chen, H., Schafer, B. & LaBoure, R. Direct strength method for Cold-Formed steel. Struct. Mag. 29–33 (2007).
Glauz, R. S. & Schafer, B. W. Modifications to the direct strength method of cold-formed steel design for members unsymmetric about the axis of bending. Thin-Walled Struct. 173, 109025 (2022).
Schafer, B. W. Advances in the direct strength method of cold-formed steel design. Thin-Walled Struct. 140, 533–541 (2019).
Fan, X. et al. Prediction of axial compressive capacity and interpretability analysis of web perforated Σ-shaped cold-formed steel. Structures 70, 107880 (2024).
Yılmaz, Y., Demi̇r, S. & Öztürk, F. Predicting the load-bearing capacity of lipped channel section cold formed steel profiles under combined effects using machine learning. Structures 66, 1–10 (2024).
Dai, Y., Fang, Z., Roy, K., Raftery, G. M. & Lim, J. B. P. Optimal design of cold-formed steel face-to-face built-up columns through deep belief network and genetic algorithm. Structures 56, 104906 (2023).
Xiao, L., Li, Q. Y., Li, H. & Ren, Q. Loading capacity prediction and optimization of cold-formed steel built-up section columns based on machine learning methods. Thin-Walled Struct. 180, 109826 (2022).
Chen, Y., Li, S., Li, C. & Zhai, C. Study on ultimate capacity and design method of cold-formed steel equal lipped angle components under axial compression. Structures 64, 106529 (2024).
Rajneesh, K. et al. Prediction of axial load capacity of cold formed lipped channel section using machine learning. Structures 50, 1429–1446 (2023).
Lu, Y. et al. Unified machine-learning-based design method for cold-formed steel multi-limbs built-up open section columns. Structures 73, (2025).
Rabi, M., Ferreira, F. P. V., Abarkan, I., Limbachiya, V. & Shamass, R. Prediction of the cross-sectional capacity of cold-formed CHS using numerical modelling and machine learning. Results Eng. 17, 100902 (2023).
Xu, Y., Zhang, M. & Zheng, B. Design of cold-formed stainless steel circular Hollow section columns using machine learning methods. Structures 33, 2755–2770 (2021).
Fang, Z., Roy, K., Chi, Y., Chen, B. & Lim, J. B. P. Finite element analysis and proposed design rules for cold-formed stainless steel channels with web holes under end-one-flange loading. Structures 34, 2876–2899 (2021).
Anbarasu, M. & Venkatesan, M. Behaviour of cold-formed steel built-up I-section columns composed of four U-profiles. Adv. Struct. Eng. 22, 613–625 (2019).
Anbarasu, M. & Adil Dar, M. Axial capacity of CFS built-up columns comprising of lipped channels with spacers: nonlinear response and design. Eng. Struct. 213, 110559 (2020).
Chen, B., Roy, K., Uzzaman, A., Raftery, G. M. & Lim, J. B. P. Parametric study and simplified design equations for cold-formed steel channels with edge-stiffened holes under axial compression. J. Constr. Steel Res. 172, 106161 (2020).
Pham, D. K., Pham, C. H. & Hancock, G. J. Parametric study for shear design of cold-formed channels with elongated web openings. J. Constr. Steel Res. 172, 106222 (2020).
Shi, G. et al. Tests and finite element analysis on the local buckling of 420 mpa steel equal angle columns under axial compression. Steel Compos. Struct. 12, 31–51 (2012).
Ellobody, E. & Young, B. Behavior of cold-formed steel plain angle columns. J. Struct. Eng. 131, 457–466 (2005).
(AISI), A. I. and S. I. North American Specification for the Design of Cold-Formed Steel Structural Members. (American Iron and Steel Institute, (2001).
Australia/New Zealand Standard (AS/NZS). Cold-Formed Steel Structures. (AS/NZS 4600:2018. Standards Australia/ Standards New Zealand. (2018).
Noh, H., Lee, S., Kim, S. M. & Mudawar, I. Utilization of XGBoost algorithm to predict dryout incipience quality for saturated flow boiling in mini/micro-channels. Int. J. Heat. Mass. Transf. 231, 125827 (2024).
Niazkar, M. et al. Applications of XGBoost in water resources engineering: A systematic literature review (Dec 2018–May 2023). Environ. Model. Softw. 174, 105971 (2024).
Quinlan, J. R. Induction of decision trees. Mach. Learn. 1, 81–106 (1986).
Song, L., Li, D., Wang, X. & Xu, X. AdaBoost maximum entropy deep inverse reinforcement learning with truncated gradient. Inf. Sci. (Ny). 602, 328–350 (2022).
Prokhorenkova, L., Gusev, G., Vorobev, A., Dorogush, A. V. & Gulin, A. CatBoost: unbiased boosting with categorical features. Adv Neural Inf. Process. Syst 31, (2018).
Joo, C., Park, H., Lim, J., Cho, H. & Kim, J. Machine learning-based heat Deflection temperature prediction and effect analysis in polypropylene composites using catboost and Shapley additive explanations. Eng. Appl. Artif. Intell. 126, 106873 (2023).
Rondinella, F., Daneluz, F., Hofko, B. & Baldo, N. Improved predictions of asphalt concretes’ dynamic modulus and phase angle using decision-tree based categorical boosting model. Constr. Build. Mater. 400, 132709 (2023).
Huang, G. et al. Evaluation of catboost method for prediction of reference evapotranspiration in humid regions. J. Hydrol. 574, 1029–1041 (2019).
Huang, P., Dai, K. & Yu, X. Machine learning approach for investigating compressive strength of self-compacting concrete containing supplementary cementitious materials and recycled aggregate. J. Build. Eng. 79, 107904 (2023).
Breiman, L. Bagging predictors. Mach. Learn. 24, 123–140 (1996).
Breiman, L. Random forests. Mach. Learn. 45, 5–32 (2001).
Hoarau, A., Martin, A., Dubois, J. C. & Le Gall, Y. Evidential random forests. Expert Syst. Appl. 230, 120652 (2023).
Sanjurjo-de-No, A., Pérez-Zuriaga, A. M. & García, A. Analysis and prediction of injury severity in single micromobility crashes with Random Forest. Heliyon 9, (2023).
Ray, S. et al. An ARIMA-LSTM model for predicting volatile agricultural price series with random forest technique [Formula presented]. Appl. Soft Comput. 149, 110939 (2023).
Dutka, A. F. & Hansen, H. H. Fundamentals of Data Normalization (Addison-Wesley Longman Publishing Co., Inc., 1991).
Ali, P. J. M., Faraj, R. H., Koya, E., Ali, P. J. M. & Faraj, R. H. Data normalization and standardization: a technical report. Mach. Learn. Tech. Rep. 1, 1–6 (2014).
Singh, D. & Singh, B. Investigating the impact of data normalization on classification performance. Appl. Soft Comput. 97, 105524 (2020).
Tran, D. T., Kumar, D. R., Keawsawasvong, S., Wipulanusat, W. & Jamsawang, P. Innovative approaches for predicting seismic stability of circular and rectangular tunnels in cohesive-frictional soils using machine learning and finite element limit analysis. Model. Earth Syst. Environ. 5831–5849. https://doi.org/10.1007/s40808-024-02080-6 (2024).
Kumar, M., Samui, P., Kumar, D. R. & Asteris, P. G. State-of-the-art xgboost, RF and DNN based soft-computing models for PGPN piles. Geomech. Geoengin. 00, 1–16 (2024).
Ozer, D. J. Correlation and the coefficient of determination. Psychol. Bull. 97, 307 (1985).
Hodson, T. O. Root mean square error (RMSE) or mean absolute error (MAE): When to use them or not. Geosci. Model. Dev. Discuss. 1–10 (2022).
Leuthold, R. M. On the use of theil’s inequality coefficients. Am. J. Agric. Econ. 57, 344–346 (1975).
Kardani, N. et al. A novel improved Harris Hawks optimization algorithm coupled with ELM for predicting permeability of tight carbonates. Eng. Comput. https://doi.org/10.1007/s00366-021-01466-9 (2021).
Kumar, M., Biswas, R., Kumar, D. R., Pradeep, T. & Samui, P. Metaheuristic Models Prediction Bearing Capacity Pile Foundation. 2, 129–147 (2022).
Kumar, D. R. et al. Machine learning approaches for prediction of the bearing capacity of ring foundations on rock masses. Earth Sci. Inf. 16, 4153–4168 (2023).
Golbraikh, A. & Tropsha, A. Beware of q 2 ! 20, 269–276 (2002).
Pant, A. & Ramana, G. V. Novel application of machine learning for Estimation of pullout coefficient of geogrid. Geosynth. Int. 29, 342–355 (2022).
Taylor, K. E. In a single diagram. 106, 7183–7192 (2001).
Acknowledgements
This work was supported by Thammasat Postdoctoral Fellowship. Thammasat University Research Unit in Data Science and Digital Transformation funded the article processing charge (APC).
Author information
Authors and Affiliations
Contributions
Pradeep Thangavel: Conceptualization, Methodology, Investigation, Data Curation, Validation, Visualization, Writing: Original Manuscript, Review and Editing; Manikandan Palanisamy: Methodology, Data Curation, Writing: Original Manuscript, Review and Editing. Divesh Ranjan Kumar: Methodology, Data Curation, Writing: Original Manuscript, Review and Editing. Warit Wipulanusat: Formal analysis, Resources, Writing–review & editing; Jirapon Sunkpho: Formal analysis, Visualization; Krishanu Roy : Formal analysis, Writing: Original Manuscript, Review and Editing;
Corresponding author
Ethics declarations
Competing interests
The authors declare no competing interests.
Additional information
Publisher’s note
Springer Nature remains neutral with regard to jurisdictional claims in published maps and institutional affiliations.
Rights and permissions
Open Access This article is licensed under a Creative Commons Attribution-NonCommercial-NoDerivatives 4.0 International License, which permits any non-commercial use, sharing, distribution and reproduction in any medium or format, as long as you give appropriate credit to the original author(s) and the source, provide a link to the Creative Commons licence, and indicate if you modified the licensed material. You do not have permission under this licence to share adapted material derived from this article or parts of it. The images or other third party material in this article are included in the article’s Creative Commons licence, unless indicated otherwise in a credit line to the material. If material is not included in the article’s Creative Commons licence and your intended use is not permitted by statutory regulation or exceeds the permitted use, you will need to obtain permission directly from the copyright holder. To view a copy of this licence, visit http://creativecommons.org/licenses/by-nc-nd/4.0/.
About this article

Cite this article
Thangavel, P., Palanisamy, M., Kumar, D.R. et al. Investigation of cold formed steel angle compression through high throughput design FEA and machine learning. Sci Rep 15, 19222 (2025). https://doi.org/10.1038/s41598-025-03991-9
Received:
Accepted:
Published:
DOI: https://doi.org/10.1038/s41598-025-03991-9
