Summary: In the modern digital landscape, Data Analytics has emerged as a powerful tool for businesses and industries seeking valuable insights to drive decision-making and improve performance. Today, it is imperative for companies to adopt data-driven decision-making processes. Using the right Data Analytics techniques can help in extracting meaningful insight, and using the same to formulate strategies.
The Analytics techniques like Descriptive Analytics, Predictive Analytics, Diagnostic Analytics, and others find application in diverse industries, including retail, healthcare, finance, and marketing. From optimizing supply chain processes to improving personalized customer experiences, leveraging the power of Analytics empowers organizations to stay ahead in an ever-evolving digital landscape.
Exploring Four Types of Analytics: Examples, Explanation, and Applications
In today’s data-driven world, Analytics has become a crucial aspect of decision-making across various industries. The ability to analyze and derive insights from vast amounts of data empowers businesses to make informed choices, optimize processes, and drive growth. There are several types of analytics techniques, each designed to address specific needs and goals.
In this blog, we will delve into four key types of analytics – Descriptive Analytics, Diagnostic Analytics, Predictive Analytics, and Prescriptive Analytics. We will explore examples, explanations, and their respective key features, along with real-world applications.
What is Data?
Data, in its most fundamental form, refers to any information, facts, or statistics collected for analysis or reference. It exists in various formats, from simple numbers to complex multimedia files, and fuels the foundation of digital innovation. The importance of data lies in its ability to provide valuable insights, guide decision-making processes, and drive progress in diverse industries.
Difference Between Data and Dataset:
Data:
- Data refers to individual facts, statistics, or pieces of information without any specific structure or organization.
- It can exist in various forms, such as text, numbers, images, or multimedia, and may not have any predefined context or purpose.
- Data is raw and unprocessed, representing discrete elements of information that can be collected from different sources.
- Examples of data include the temperature reading of a city, the sales figure for a particular product, or the name of a person.
Dataset:
- A dataset, on the other hand, is a structured and organized collection of related data points or observations.
- It is curated intentionally for a specific purpose, often to analyze and derive insights from the data it contains.
- Datasets are typically formatted and stored in files, databases, or spreadsheets, allowing for easy access and analysis.
- Examples of datasets include a spreadsheet containing information about customer demographics, a database of medical records, or a collection of images for training an AI model.
The Role of Data in the Digital Age
Data plays a pivotal role in shaping the technological landscape in today’s interconnected world. Data forms the backbone of numerous cutting-edge technologies, from Business Analytics to Artificial Intelligence. Companies harness the power of data to understand consumer behavior, optimize processes, and create personalized experiences, giving them a competitive edge in the market.
Types of Data:
- Structured Data
Structured data represents information organized in a predetermined format, typically in databases or spreadsheets. It follows a specific schema, making it easy to analyze and process. This data type is commonly used in business environments for various applications, such as financial reporting and customer relationship management.
- Unstructured Data
Unstructured data, however, lacks a predefined structure, making it more challenging to organize and analyze. Examples of unstructured data include text files, images, audio, and video content. While unstructured data may seem chaotic, advancements in artificial intelligence and machine learning enable us to extract valuable insights from this data type.
- Big Data
Big Data refers to vast volumes of information that exceed the processing capabilities of traditional databases. Characterized by the three Vs: volume, velocity, and variety, Big Data poses unique challenges and opportunities. It requires sophisticated tools and algorithms to derive meaningful patterns and trends from the sheer magnitude of data.
- Meta Data
Metadata, often dubbed “data about data,” provides essential context and descriptions for other datasets. It includes information such as data source, creation date, and data format. Metadata enhances the understanding and usability of primary datasets, making it crucial for effective data management.
The Data Life Cycle:
Understanding the data life cycle is vital for maximizing its potential. The life cycle consists of several stages, each contributing to the data management process.
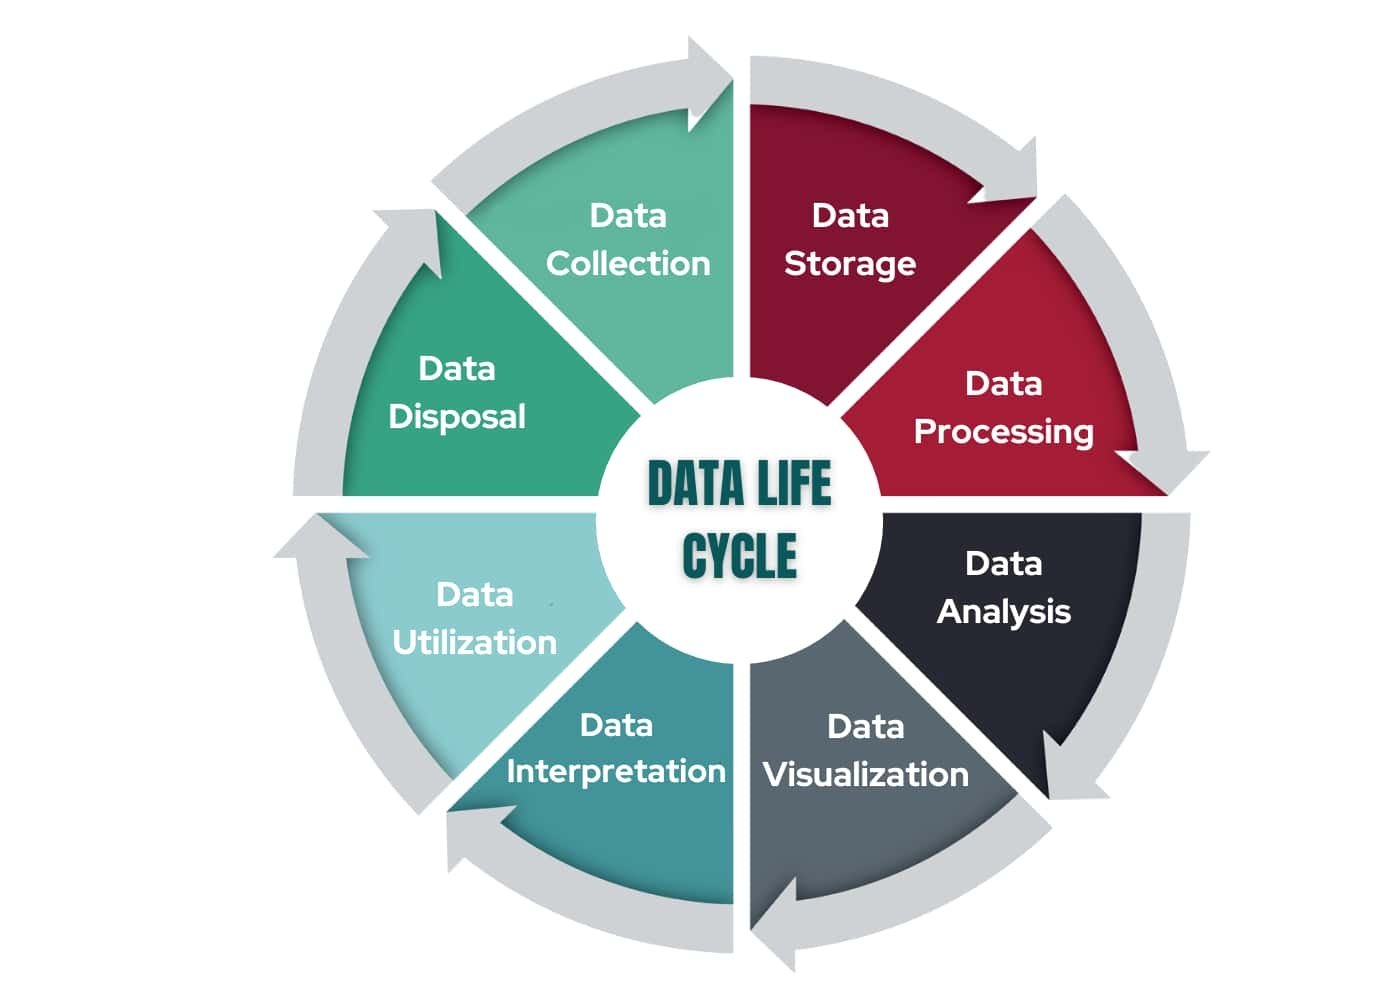
- Data Collection:
Data collection is the initial phase, where information is gathered from various sources, such as surveys, sensors, or customer interactions. Proper data collection practices are critical to ensure accuracy and reliability.
- Data Storage:
After collection, the data needs a secure and accessible storage system. Organizations may use databases, data warehouses, or cloud-based storage solutions depending on the type and volume of data.
- Data Processing:
Data processing involves cleaning, transforming, and organizing the collected data to prepare it for analysis. This step is crucial for eliminating inconsistencies and ensuring data integrity.
- Data Analysis:
Data Analysis is the heart of deriving insights from the gathered information. Various statistical and Machine-Learning techniques uncover patterns, trends, and correlations.
- Data Visualization:
Data Visualization transforms complex data sets into intuitive and visually appealing representations. Graphs, charts, and infographics aid in conveying information effectively.
- Data Interpretation:
Interpreting the results of Data Analysis is essential for drawing meaningful conclusions and making data-driven decisions. Accurate interpretation hinges on the expertise of Data Analysts and domain experts.
- Data Utilization:
Data utilization refers to the practical application of insights gained from Data Analysis. Organizations use this knowledge to optimize processes, enhance products, and improve customer experiences.
- Data Disposal:
As data ages or becomes obsolete, proper data disposal practices ensure sensitive information is securely removed or archived. This step is crucial for data privacy and regulatory compliance.
The Impact of Data on Various Industries:
- Healthcare
Data-driven healthcare has revolutionized patient care. Electronic health records, medical imaging, and wearable devices generate vast amounts of data, allowing healthcare professionals to make more accurate diagnoses and personalized treatment
- Finance
Data Analysis is instrumental in detecting fraud, predicting market trends, and managing risk in the financial sector. Real-time data feeds and algorithmic trading strategies have transformed the dynamics of financial markets.
- Education
Data Analytics in education enables personalized learning experiences and helps educators identify students’ strengths and weaknesses. Learning management systems and educational apps generate valuable data for continuous improvement.
- Retail
Data-driven retail strategies, such as customer segmentation and personalized marketing, enhance customer engagement and loyalty. E-commerce platforms leverage data to recommend products and improve conversion rates.
- Transportation
The transportation industry benefits from data through route optimization, traffic management, and predictive maintenance. Connected vehicles generate data that powers smart transportation systems.
Data Privacy and Ethical Considerations:
With the vast accumulation of data comes the responsibility to protect individuals’ privacy and uphold ethical standards. Data breaches and misuse can have severe consequences for both businesses and individuals. Implementing robust data security measures and adhering to ethical data practices are paramount.

The Future of Data
As technology advances and the world becomes increasingly interconnected, data will continue to shape our future. From the Internet of Things (IoT) to advanced artificial intelligence, the potential of data-driven innovations is boundless. Embracing data-driven approaches will be crucial for staying competitive and relevant in the rapidly evolving digital landscape.
Data Analysis employs various analytics techniques to gain valuable insights and make informed decisions. Let’s explore some of the key analytics techniques and their significance:
1. Descriptive Analytics
Descriptive analytics involves examining historical data to understand past performance and trends. It provides a summary of what has happened, making it a fundamental starting point for Data Analysis. Descriptive Analytics helps identify patterns, outliers, and overall data characteristics, allowing businesses to comprehensively understand their historical performance.
2. Diagnostic Analytics
Diagnostic analytics goes further than descriptive analytics by focusing on why certain events occurred. It involves investigating the root causes behind specific outcomes or trends observed in the data. This technique helps organizations identify factors that contributed to success or failure, enabling them to make necessary adjustments and improve future performance.
3. Predictive Analytics
This method relies on the use of historical data and statistical algorithms to predict future outcomes. Predictive analytics helps forecast potential scenarios and understand likely future events by analyzing patterns and trends. This technique is invaluable for anticipating customer behavior, demand patterns, and market trends, enabling proactive decision-making.
4. Prescriptive Analytics
It takes Data Analysis to the next level by predicting future outcomes and recommending actions to achieve desired results. It leverages advanced algorithms and optimization techniques to suggest the best action based on various constraints and objectives. Prescriptive analytics empowers decision-makers with actionable insights, enabling them to optimize processes and resources effectively.
5. Text Analytics (Natural Language Processing)
Text analytics, also known as Natural Language Processing (NLP), involves extracting valuable information and insights from unstructured text data, such as customer reviews, social media posts, or survey responses. NLP algorithms process language patterns, sentiment, and context, enabling organizations to better understand customer feedback and market sentiment.
6. Social Media Analytics
Social Media Analytics focuses on monitoring and analyzing Social Media platforms to gain insights into customer preferences, behavior, and opinions. By tracking mentions, engagements, and sentiment, businesses can assess their brand perception, conduct competitor analysis, and tailor their marketing strategies accordingly.
7. Spatial Analytics
Spatial analytics utilizes geographical data to identify patterns and trends related to location. It is particularly useful for businesses operating in diverse regions, such as retail chains or logistics companies. Spatial Analytics helps optimize store locations, supply chain routes, and territory management.
8. Time Series Analysis
Time Series Analysis analyses data collected over successive intervals. It is commonly employed to identify trends, and seasonality, and forecast future values. Time series analysis finds applications in financial markets, weather forecasting, and sales forecasting.
9. Machine Learning
Machine Learning is an advanced technique that uses algorithms to enable computers to learn and improve from experience without being explicitly programmed. It helps automate complex data analysis tasks, recognize patterns, and make accurate predictions.
Significance of Analytics Techniques in Data Analysis:
- Better Decision-Making
By leveraging analytics techniques, organizations can make data-driven decisions based on evidence and insights rather than relying on intuition alone. This leads to more informed and effective decision-making, improving performance and outcomes.
- Improved Efficiency and Productivity
Analytics techniques help identify inefficiencies and bottlenecks in processes, enabling organizations to optimize their operations. By streamlining processes, businesses can enhance productivity and resource utilization.
- Enhanced Customer Experience
Understanding customer behavior through analytics allows businesses to offer personalized experiences and tailor their products and services to meet specific customer needs. This leads to higher customer satisfaction and loyalty.
- Competitive Advantage
Companies that harness the power of analytics gain a competitive edge by staying ahead of market trends, predicting customer preferences, and responding quickly to changing demands. This advantage can be a differentiator in highly competitive industries.
- Risk Mitigation
Predictive analytics and other advanced techniques help identify potential risks and threats, enabling organizations to take proactive measures and reduce the likelihood of adverse events.
- Innovation and New Opportunities
By analyzing data, organizations can uncover new opportunities for innovation and growth. Analytics can lead to discovering untapped markets, new product ideas, and novel business strategies.
Types of Analytics:
1. Descriptive Analytics with Example Explained
Descriptive Analytics summarises and interprets historical data. It helps in gaining insights into past performance. This type of analytics helps organizations understand what happened and provides a solid foundation for further analysis. It involves the use of simple statistical methods and data visualization tools to present data in a meaningful way.
Examples of Descriptive Analytics:
- Sales Performance Analysis: Analyzing sales data over the past year to identify trends, top-selling products, and peak sales periods.
- Website Traffic Analysis: Examining website traffic metrics to understand user behavior, popular pages, and traffic sources.
Key Features:
- Data Aggregation: Collecting and consolidating data from various sources into a comprehensive dataset.
- Data Visualization: Representing data through charts, graphs, and dashboards for easy comprehension.
- Performance Metrics: Utilizing key performance indicators (KPIs) to measure performance against organizational goals.
Application:
Descriptive Analytics finds applications in retail, marketing, finance, and healthcare industries. Retailers use it to optimize inventory management, while marketers analyze customer behavior or tailor campaigns effectively. In healthcare, it aids in patient outcome analysis and resource allocation.
2. Diagnostic Analytics with Example Explained
Diagnostic Analytics seeks to understand why certain events occurred by drilling deeper into the data to identify patterns and root causes. This type of analytics is valuable for uncovering insights that can lead to process improvements and issue resolution.
Examples of Diagnostic Analytics:
- Churn Analysis: Investigating factors contributing to customer churn, such as poor service or product dissatisfaction.
- Quality Control Analysis: Identifying the reasons behind a sudden drop in product quality on the production line.
Key Features:
- Drill-Down Capabilities: The ability to explore data at granular levels to identify contributing factors.
- Correlation Analysis: Uncovering relationships between variables to understand how changes in one impact the other.
- Hypothesis Testing: Employing statistical tests to validate hypotheses about causal relationships.
Application:
Diagnostic Analytics is commonly used in manufacturing, customer service, and supply chain management. Manufacturers use it to improve production processes, while customer service teams analyze call data to enhance customer satisfaction.
3. Predictive Analytics with examples explained
Predictive Analytics leverages historical data and statistical algorithms to predict future events. It aims to forecast outcomes and trends, enabling organizations to make proactive decisions and seize opportunities.
Examples of Predictive Analytics:
- Stock Market Prediction: Forecasting stock prices based on historical market data and relevant indicators.
- Customer Lifetime Value Prediction: Predicting the potential lifetime value of a customer based on past behaviors and interactions.
Key Features:
- Data Modeling: Developing predictive models using machine learning algorithms like regression, decision trees, and neural networks.
- Data Cleansing: Ensuring data quality and removing outliers to improve model accuracy.
- Scenario Analysis: Evaluating scenarios to understand potential outcomes under various conditions.
Application:
Predictive Analytics finds applications in marketing, finance, healthcare, and risk management. Marketers use it for targeted advertising, and insurers leverage it to assess the likelihood of insurance claims.
4. Prescriptive Analytics with Example Explained
Prescriptive Analytics takes predictive analytics further by recommending the best course of action to achieve a desired outcome. It utilizes optimization algorithms and simulation techniques to provide decision-makers with actionable insights.
Examples of Prescriptive Analytics:
- Supply Chain Optimization: Recommending the most efficient supply chain routes to minimize costs and delivery times.
- Resource Allocation: Determining the optimal allocation of resources to maximize productivity and minimize waste.
Key Features:
- Optimization Models: Creating mathematical models to optimize decisions and allocate resources efficiently.
- Simulation Tools: Using simulations to visualize the potential impact of different decisions.
- Decision Support Systems: Integrating prescriptive analytics into decision-making processes for real-time recommendations.
Application:
Prescriptive Analytics is widely used in logistics, finance, and resource planning. Companies use it to optimize production schedules and resource allocation, increasing productivity and cost savings.
Conclusion
Analytics plays a pivotal role in modern business, enabling data-driven decision-making and providing a competitive edge. Each of the four types of analytics explained here brings unique benefits and applications. From understanding historical performance to making informed predictions and recommending optimal decisions, analytics techniques empower organizations to thrive in today’s dynamic environment. By harnessing the power of data and analytics, businesses can unlock hidden insights and drive success across various sectors.
Get Started with Data Today
Expertise in the data domain has become the need of the hour. Choosing the right course and learning platform can enhance your prospects of growth. Pickl.AI is offering the best Data Science courses, and their Data Science Job Guarantee Programme also promises assured placement post the completion of the course. To start your learning journey, you can read data demystefied books , and also enroll in the Data Science program by Pickl.AI. To know more about Pickl.AI courses, drop an email at care@pickl.ai.


![8 Best Books for SQL [Beginners and Advanced Learners]](https://www.pickl.ai/blog/wp-content/uploads/2023/02/8-Best-Books-for-SQL-150x150.jpg)