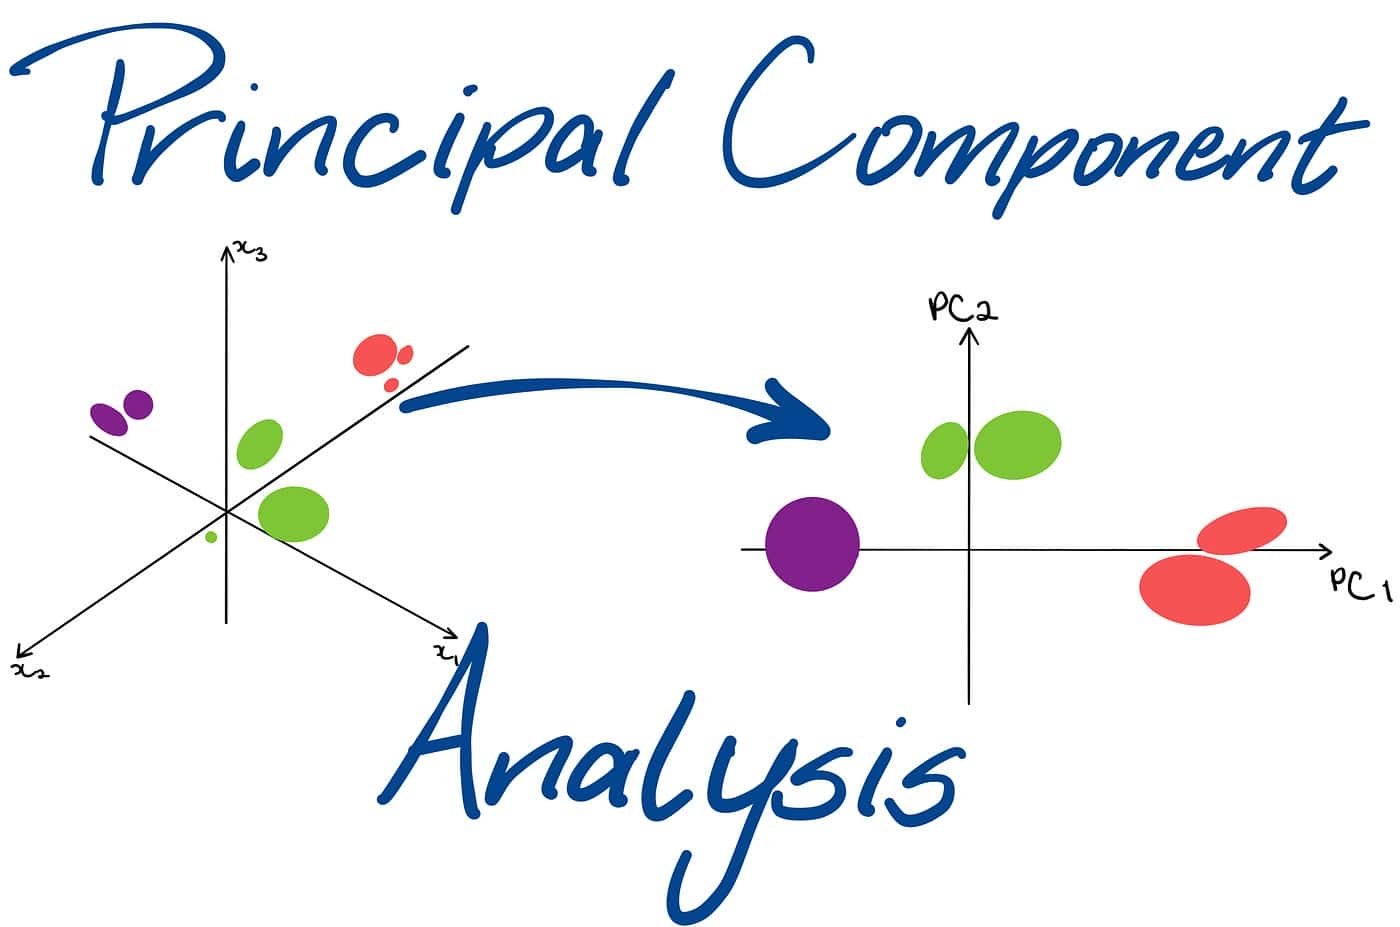
Principal component analysis (PCA) is a popular unsupervised Machine Learning technique for reducing the dimensionality of large datasets. By reducing the number of variables, PCA helps to simplify data and make it easier to analyze. It accomplishes this by finding new features, called principal components, that capture the most significant patterns in the data. These principal components are ordered by importance, with the first component explaining the most variance in the data. PCA is a valuable tool for exploratory data analysis in various applications, including image compression, computer vision, and anomaly detection.
PCA in machine learning
Source: https://towardsdatascience.com/understanding-principal-component-analysis-ddaf350a363a
Have you ever encountered a dataset with an overwhelming number of features? Managing and analyzing such high-dimensional data can be challenging. This is where Principal Component Analysis (PCA) comes in – a powerful dimensionality reduction technique that simplifies complex data without losing significant information.
This comprehensive guide is designed for beginners to grasp the core concepts of PCA in Machine Learning and its practical applications. We’ll break down the process step-by-step, explore its benefits and limitations, and answer frequently asked questions. So, buckle up and get ready to dive into the world of PCA!
Understanding the basics of PCA
Imagine you have a dataset containing information about different types of flowers, with features like petal length, width, colour, and sepal measurements. While this data is rich, analyzing all these features simultaneously can be cumbersome. PCA helps you find a smaller set of features, called principal components (PCs), that capture most of the information from the original data.
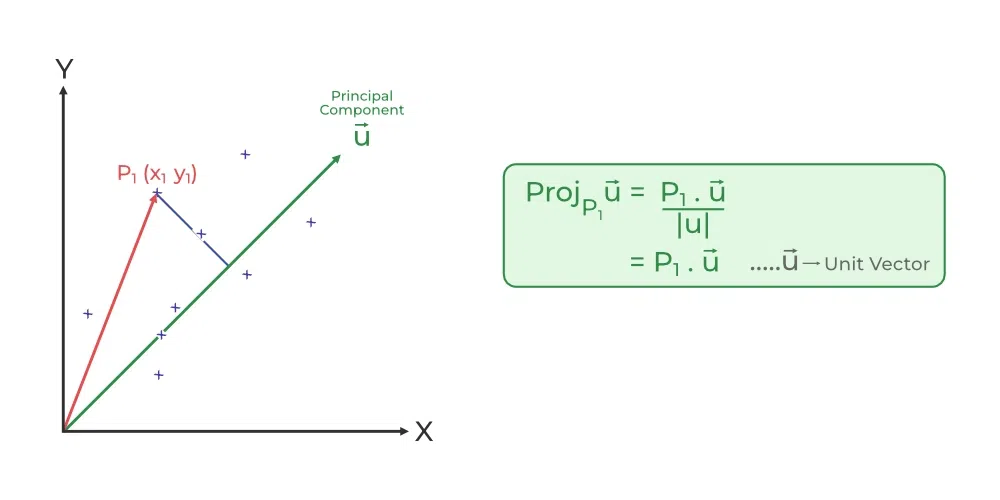
Think of PCs as new directions or axes explaining the maximum data variance. By projecting the data onto these new axes, you can represent the information in a lower-dimensional space, making it easier to visualize and analyze.
Benefits of PCA
Here’s why PCA is a valuable tool for beginners venturing into data analysis:
-
Simplifies complex data
PCA reduces clutter by identifying the most significant features, making data visualization and interpretation more manageable.
-
Improves Machine Learning performance
Many Machine Learning algorithms struggle with high-dimensional data. PCA reduces dimensionality, leading to faster training times and potentially improving model accuracy by avoiding overfitting.
-
Reduces noise and redundancy
Hidden patterns and trends become clearer as PCA eliminates irrelevant information and noise present in the data.
-
Reduces overfitting
High-dimensional data can lead to overfitting in Machine Learning models. By reducing the number of dimensions, PCA helps to simplify the data and prevent the model from memorizing irrelevant noise.
-
Improves training Speed
Training Machine Learning models on high-dimensional data can be computationally expensive. PCA reduces the number of features, leading to faster training times.
-
Better algorithm performance
Many Machine Learning algorithms perform better with lower-dimensional data. PCA can improve the performance of these algorithms by reducing the dimensionality of the data.
-
Feature selection
PCA can help identify the most important features in a dataset. This can be useful for selecting features for a Machine Learning model.

Step-by-Step Guide to PCA
Step 1: Data preparation
- Data collection: Gather the dataset you want to analyze using PCA.
- Data cleaning: Handle missing values and outliers if necessary.
- Data normalization: Standardize the data with a mean of 0 and a standard deviation 1 across features.
Step 2: Covariance matrix calculation
- Calculate the covariance matrix of the standardized data.
- The covariance matrix indicates the relationships between different features in the dataset.
Step 3: Eigenvector and eigenvalue calculation
- Compute the eigenvectors and eigenvalues of the covariance matrix.
- Eigenvectors represent the directions of the new feature space.
- Eigenvalues indicate the magnitude of variance explained by each eigenvector.
Step 4: Sorting eigenvalues
- Sort the eigenvalues in descending order.
- This step helps select the principal components that capture the most variance in the data.

Step 5: Choosing principal components
- Decide the number of principal components (PCs) to retain.
- You can retain as many principal components as needed to explain a certain percentage of the total variance (e.g., 95%).
Step 6: Constructing the projection matrix
- Select the top k eigenvectors corresponding to the k largest eigenvalues.
- These eigenvectors form the projection matrix.
Step 7: Projecting data onto new feature space
- Multiply the standardized data by the projection matrix to obtain the new feature space.
- The new feature space consists of principal components.
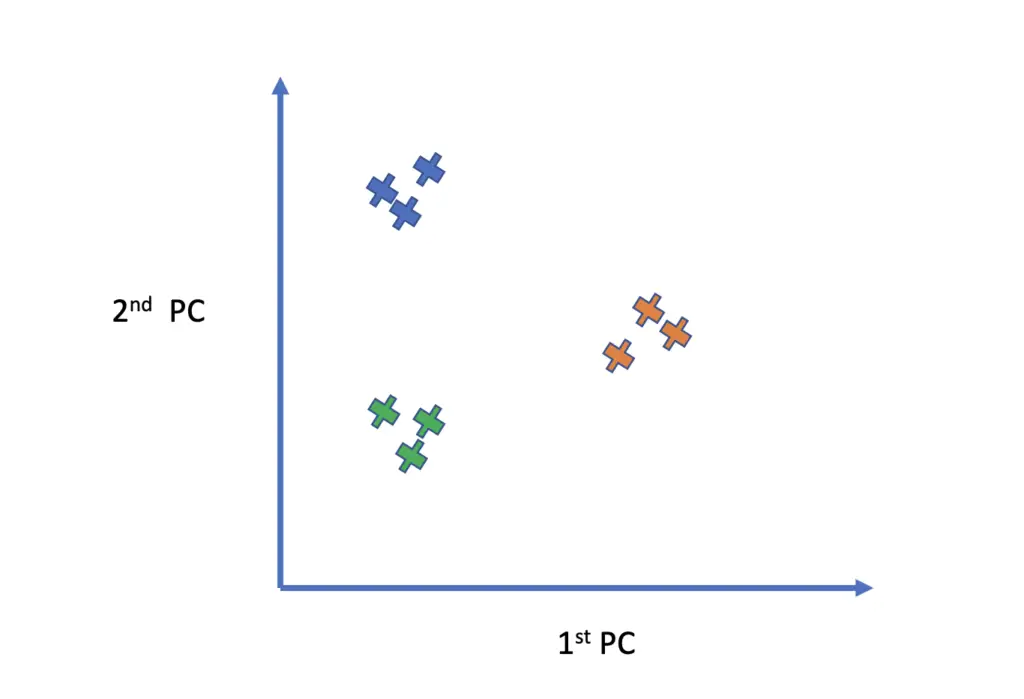
Step 8: Interpreting results
- Analyze the principal components to understand the underlying structure of the data.
- Higher eigenvalues indicate that the corresponding principal components explain more variance in the data.
- Visualize the data in the new feature space to gain insights.
Step 9: Implementing PCA in Machine Learning models
- Apply PCA as a preprocessing step before feeding data into Machine Learning algorithms.
- Use the reduced dimensionality data (principal components) to train your models.
- Evaluate model performance and compare results with and without PCA.

Step 10: Fine-tuning and optimization
- Experiment with different numbers of principal components.
- Monitor the explained variance ratio to ensure the selected components capture sufficient information.
- Tune other parameters in your Machine Learning pipeline based on the results.
Following these steps, you can effectively apply Principal Component Analysis in your Machine Learning projects to reduce dimensionality and extract meaningful insights from high-dimensional data.
Applications of PCA in real life
PCA finds applications in various domains:
-
Image compression
Images can be represented using fewer pixels while retaining most visual information with PCA.
-
Recommendation systems
Recommender systems leverage PCA to identify patterns in user behaviour and product attributes, leading to better recommendations.
-
Anomaly detection
PCA can be used to establish a baseline for normal data patterns. Deviations from this baseline might indicate anomalies, aiding in fraud or network intrusion detection.
Challenges and limitations of PCA
While powerful, PCA has limitations:
-
Loss of information
Reducing dimensionality inherently leads to some information loss. The key is to strike a balance between data compression and information retention.
-
Interpretability of principal components
Understanding the meaning of principal components can be challenging, especially when dealing with datasets with many features.
-
Non-linear relationships
PCA is effective for capturing linear relationships between features. It might not be suitable for datasets with strong non-linear relationships.
Conclusion:
PCA is a cornerstone technique for dimensionality reduction. By simplifying complex data, improving Machine Learning performance, and reducing noise and redundancy, PCA empowers beginners and experienced data analysts alike. It offers a powerful data exploration, visualization, and model-building tool.
While PCA has limitations, understanding its core concepts and applications equips you to make informed decisions about its suitability for your data analysis tasks. As you gain experience, you can explore more advanced dimensionality reduction techniques. Remember, PCA is a stepping stone on your data science journey, and its value lies in its ability to unlock hidden insights from complex datasets.
So, the next time you encounter a high-dimensional dataset, consider using PCA to transform it into a more manageable and informative representation. With its ease of implementation and interpretability, PCA is a valuable asset for anyone venturing into the exciting world of data analysis!


Thanks for sharing. I read many of your blog posts, cool, your blog is very good.