8-Week SQL Challenge: Data Bank
Transaction Data Analysis—Case Study #4 by Data with Danny
As a huge FinTech enthusiast, I found myself totally drawn to this project. It was one of the most challenging projects I have ever worked on, and I loved every bit of it. Before we dive right in, you’d totally love to check out the deliverables that came with this project (a PowerPoint presentation and a very insightful Power BI dashboard).
See the links below!
Now, let’s get started. 🙌

Introduction
There is a new innovation in the financial industry called Neo-Banks: new aged digital-only banks without physical branches.
Danny thought that there should be some sort of intersection between these new-age banks, cryptocurrency, and the data world…so he decides to launch a new initiative — Data Bank!
Data Bank runs just like any other digital bank — but it isn’t only for banking activities, they also have the world’s most secure distributed data storage platform!
Customers are allocated cloud data storage limits which are directly linked to how much money they have in their accounts. There are a few interesting caveats that go with this business model, and this is where the Data Bank team needs your help!
The management team at Data Bank wants to increase its total customer base — but also needs some help tracking just how much data storage its customers will need.
This case study as we’ve mentioned above is all about calculating metrics, and growth and helping the business analyze their data in a smart way to better forecast and plan for their future developments!
Available Data
The Data Bank team has prepared a data model for this case study as well as a few example rows from the complete dataset below to get you familiar with their tables.
Entity Relationship Diagram

Before we dive into the analysis, let’s take a moment to understand the different tables that were eventually created in the database.
Table 1: Regions
Just like popular cryptocurrency platforms — Data Bank is also run off a network of nodes where both money and data are stored across the globe. In a traditional banking sense — you can think of these nodes as bank branches or stores that exist around the world.
This regions table contains the region_id and their respective region_name values.

Table 2: Customer Nodes
Customers are randomly distributed across the nodes according to their region — this also specifies exactly which node contains both their cash and data.
This random distribution changes frequently to reduce the risk of hackers getting into Data Bank’s system and stealing customers’ money and data!
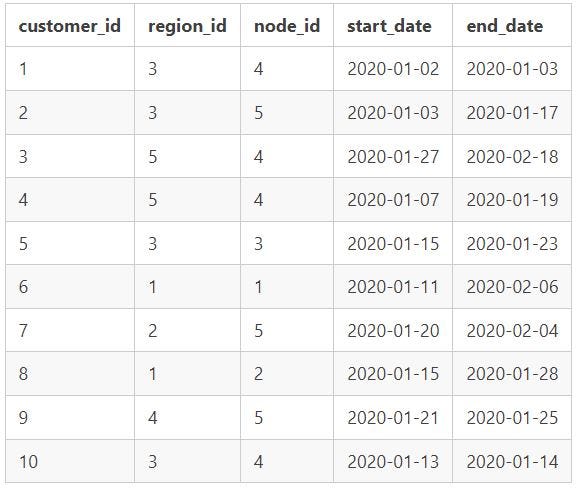
Below is a sample of the top 10 rows of the data_bank.customer_nodes
Case Study Questions
The following case study questions include some general data exploration analysis for the nodes and transactions before diving right into the core business questions and finishing with a challenging final request!
The case study questions are grouped into:
A. Customer Nodes Exploration
B. Customer Transactions
C. Data Allocation Challenge
E. Extra Challenge
F. Extension Request
A. Customer Nodes Exploration
- How many unique nodes are there in the Data Bank system?
Solution
- Use COUNT DISTINCT to find the number of unique nodes
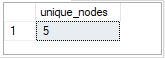
There are 5 unique nodes(branches) in the Data Bank System.
2. What is the number of nodes per region?
Solution
- Use COUNT to get the number of nodes per region
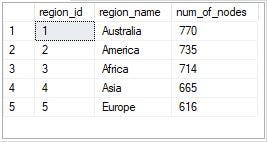
Australia had the highest number of nodes occurrences (770), followed by America (735) with Europe having the least number of nodes (616).
3. How many customers are allocated to each region?
Solution
steps:
- Use COUNT DISTINCT to find the number of customers per region.
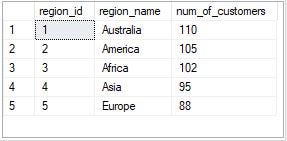
Australia had the highest number of customers allocated to that region, followed by America, while Europe had the least number of customers.
4. How many days on average are customers reallocated to a different node?
Solution
- First of all, look at the unique start dates and end dates.
- The result shows there is an abnormal date, which is ‘9999–12–31’
- The date is incorrect, might be a typo error, and therefore needs to be excluded from the query.
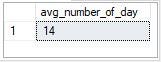
It takes 14 days on average for customers to be reallocated to a different region.
5. What is the median, 80th, and 95th percentile for this same reallocation days metric for each region?
Solution
- Use a CTE to find the difference between start_date and end_date
- Use PERCENTILE_CONT and WITHIN GROUP to find the median, 80th, and 95th percentile
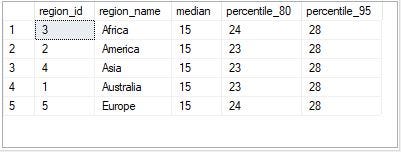
The output shows that all the regions have the same median and 95th percentile for the same reallocation days metric with Africa and Europe having 24 days as the 80th percentile and America, Asia, and Australia having 23 days as the 80th percentile reallocation metric.
B. Customer Transactions
- What is the unique count and total amount for each transaction type?
Solution
- Use COUNT to find the unique count of the transaction types
- Use SUM to find the total amount for each transaction type
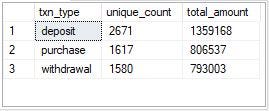
There were more deposits (2671), followed by purchases (1617), and then withdrawals (1580).
2. What is the average total historical deposit counts and amounts for all customers?
Solution
- Create a CTE named deposit_summary that calculates the total deposit counts and amounts for each customer.
- Use the deposit_summary CTE in the outer query to calculate the average total deposit counts and amounts for all customers using the AVG function.
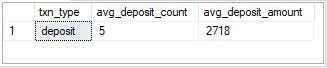
The average deposit count for a customer is 5 and the average deposit amount for a customer is 2,718.
3. For each month — how many Data Bank customers make more than 1 deposit and either one purchase or withdrawal in a single month?
Solution
- Create a CTE named customer_activity that calculates the number of deposits, purchases, and withdrawals for each customer for each month using the DATEPART and DATENAME functions to extract the month number and month name from the txn_date column.
- Use the main query to filter the customer activity CTE to include only customers who made more than 1 deposit and either 1 purchase or 1 withdrawal in a single month.
- We then group the results by month number and month name and count the number of unique customers who meet this criterion.
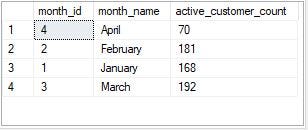
March had the highest number of customers (192) who had made more than 1 deposit and either 1 withdrawal or 1 deposit, while April had the least number of such customers (70).
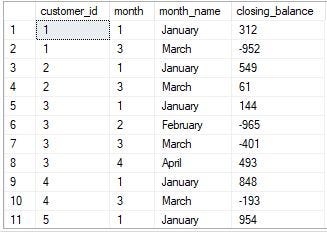
4. What is the closing balance for each customer at the end of the month?
Solution
- Use a CTE to aggregate the customer transaction data by the customer and by month.
- In the SELECT clause of the CTE,
— Use the DATEADD function to truncate the txn_date column to the beginning of the month. This is done to group the transactions by month, regardless of the actual day of the month when the transaction was made.
— Use the SUM function to calculate the total number of transactions for each customer within each month. The CASE statement is used to distinguish deposits and withdrawals so that withdrawals are subtracted from the total amount.
- Use a final query to calculate the closing balance of a customer for a specific month, with the closing balance being the sum of all transaction amounts up to and including that month. In the final query:
— Use the MONTH and DATENAME functions to extract the month id and name from the month_start column of the CTE.
— Use the SUM function with the OVER clause to calculate the running total of the total_amount column for each customer, partitioned by the customer id and ordered by the month start. This running total gives the closing balance for each customer at the end of the month.
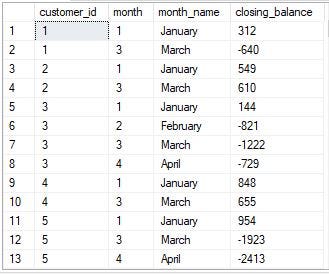
The output above isn’t complete. I had to cut it because it was long.
5. What is the percentage of customers who increase their closing balance by more than 5%?
Solution
- Use monthly_transaction CTE to calculate the total transactions for each customer for each month
- Use the closing_balances CTE to calculate the closing balance for each customer for each month by summing up the transactions from the previous months.
- Use pct_increase CTE to calculate the percentage increase in closing balance for each customer from the previous month.
- Use the pct_increase in the final query to calculate the percentage of customers whose closing balance increased by more than 5% compared to the previous month. It does this by counting the number of distinct customers whose pct_increase is greater than 5 and dividing that by the total number of distinct customers.
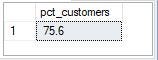
75.6 percent of the customers had their closing balance increase by 5% compared to the previous month.
C. Data Allocation Challenge
For this multi-part challenge question — you have been requested to generate the following data elements to help the Data Bank team estimate how much data will need to be provisioned for each option:
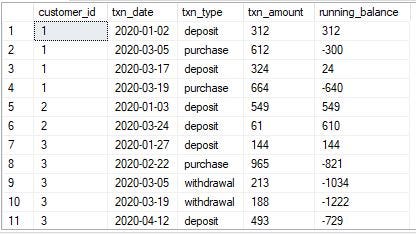
1. running a customer balance column that includes the impact of each transaction
Solution
- Calculate the running balance for each customer based on the order of their transactions.
- Adjust the ‘txn_amount’ to be negative for withdrawal and purchase transactions to reflect a negative balance.
2. Customer balance at the end of each month
Solution
- Calculate the closing balance for each customer for each month.
- Adjust the ‘txn_amount’ to be negative for withdrawal and purchase transactions to reflect a negative balance.
3. minimum, average, and maximum values of the running balance for each customer
Solution
- Use a CTE to find the running balance of each customer based on the order of transactions.
- Then calculate the minimum, maximum, and average balance for each customer.
The above data points in Part C are the data points we need to carry out the Data Allocation experiment, whose full code you’ll find on my GitHub repo.
The Part D; Extra Challenge full code and explanations can also be found in my GitHub repo via the above link.
The final part of the case study, the extension request, is a PowerPoint presentation that will be used as marketing material for both external investors who might want to buy Data Bank shares and new prospective customers who might want to bank with Data Bank. And I hope that after you’ve gone through my presentation here, you’ll want to invest in Data Bank.
I also created a four-page dashboard on Power BI that Data Bank’s team can use to understand the performance of the business and gain insights on the data allocation options that were tested out in an experiment.
You’d love to interact with the dashboard here.
And feel free to say hi on Linkedin and connect with me on Twitter. 🙌🤝