
What is Probability?
Probability refers to denoting the possibility of something happening. In Mathematical terms, it is a concept that predicts how likely events are to occur.
What are Probability Distributions?
Probability Distributions are used in statistical terms that helps in describing the possible values and probabilities for a random variable within a given range. The range is typically bound by minimum and maximum possible values. However, the possible value that is supposed to be on the distribution is determined by number of factors. These factors include mean, standard deviation, skewness and kurtosis.
Characteristics of probability distribution:
Probability distributions are mathematical functions that describe the likelihood of different outcomes or events in a random experiment or process. They are essential in statistical analysis and provide important insights into the behavior of random variables. Here are some key characteristics of probability distributions:
-
Domain
A probability distribution defines the set of possible values that a random variable can take. The domain of a distribution can be discrete (a countable set of values) or continuous (an interval or range of values).
-
Probability density or mass function
The probability density function (PDF) or probability mass function (PMF) determines the probability of a random variable taking a specific value or falling within a particular interval. For discrete distributions, the PMF gives the probability of each possible value, while for continuous distributions, the PDF provides the likelihood of values within a range.
-
Probability properties
The probabilities assigned by a distribution must satisfy certain properties. For discrete distributions, the probabilities must be non-negative and sum up to 1 over all possible values. For continuous distributions, the area under the PDF curve over the entire range must equal 1.
-
Mean (expectation)
The mean, often denoted as μ or E(X), represents the average value of a random variable. It is calculated as the weighted sum of the possible values of the random variable, with each value weighted by its probability.
-
Variance
The variance, denoted as σ^2 or Var(X), measures the spread or dispersion of the random variable around its mean. It quantifies how much the values deviate from the average value. The square root of the variance is called the standard deviation (σ).
-
Skewness
Skewness measures the asymmetry of a distribution. A distribution is symmetrical if its right and left sides are mirror images. Positive skewness indicates a longer or fatter tail on the right side, while negative skewness means a longer or fatter tail on the left side.
-
Kurtosis
Kurtosis measures the degree of peakedness or flatness of a distribution’s shape. It compares the distribution’s tails to those of the normal distribution. Positive kurtosis indicates a more peaked distribution with heavier tails, while negative kurtosis implies a flatter distribution with lighter tails.
-
Moments
Moments are statistical quantities used to describe the shape, center, and spread of a distribution. The mean and variance are examples of the first and second moments, respectively. Higher moments provide additional information about the distribution’s shape and tail behavior.
-
Cumulative distribution function (CDF)
The cumulative distribution function gives the probability that a random variable takes on a value less than or equal to a given value. It provides a complete description of the distribution by summarizing the probabilities for all values of the random variable.
These characteristics help statisticians and researchers understand the behavior of random variables and make informed decisions based on the underlying probability distributions. Different distributions have unique sets of characteristics, which allow them to model various real-world phenomena accurately.
Uses of probability distribution:
Probability distributions have a wide range of applications in various fields. Here are some common uses of probability distributions:
1. Statistical Analysis:
Probability distributions serve as the foundation of statistical analysis. They help describe and model the uncertainty associated with random variables and enable the calculation of probabilities, expected values, variances, and other statistical measures.
2. Risk Assessment:
Probability distributions are used to assess and quantify risk in different scenarios. By modeling the uncertainty of events or outcomes, probability distributions can help identify and evaluate potential risks, determine the likelihood of certain events occurring, and estimate the potential impact of those events.
3. Decision Making:
Probability distributions provide a framework for decision making under uncertainty. They can be used to analyze different options, assess the probabilities and potential outcomes associated with each option, and make informed decisions based on expected values or other decision criteria.
4. Financial Modeling:
Probability distributions are extensively used in finance and investment analysis. They can be employed to model stock prices, interest rates, asset returns, and other financial variables. Monte Carlo simulations, based on probability distributions, are used to assess investment portfolios, pricing options, and estimate risk measures like Value-at-Risk (VaR).
5. Quality Control:
In manufacturing and quality control processes, probability distributions help analyze and control variation in product characteristics. They are used to model and understand the distribution of measurements and defects, set quality control limits, and make decisions based on statistical process control techniques.
6. Reliability Analysis:
Probability distributions play a vital role in reliability engineering. They are used to model and analyze the lifetime or failure characteristics of components, systems, or processes. Reliability distributions help estimate the probability of failure or the remaining useful life of a product.
7. Forecasting:
Probability distributions can be used to forecast future events or outcomes based on historical data. By fitting data to an appropriate distribution, analysts can make probabilistic forecasts and assess the uncertainty surrounding the predictions.
8. Simulation and Optimization:
Probability distributions are used in simulation models to replicate real-world scenarios and analyze complex systems. By sampling from appropriate distributions, simulations can generate random inputs and evaluate the behavior and performance of systems or processes. Optimization techniques often rely on probability distributions to model uncertain parameters and find optimal solutions.
These are just a few examples of how probability distributions are used across various fields. Probability theory and distributions provide a powerful framework for understanding uncertainty, analyzing data, and making informed decisions.
Types of Probability Distribution with Examples:
There are numerous probability distributions, each with its own characteristics and applications. Here are some common types of probability distributions along with examples:
Discrete Distributions:

- Bernoulli Distribution: Models a single binary outcome with two possible values (e.g., success or failure, heads or tails).
- Binomial Distribution: Represents the number of successes in a fixed number of independent Bernoulli trials (e.g., the number of heads in 10 coin flips).
- Poisson Distribution: Describes the number of events that occur in a fixed interval of time or space, assuming a constant rate of occurrence (e.g., the number of emails received per hour).
Continuous Distributions:
- Uniform Distribution: Provides equal probability to all values within a specified range (e.g., a random number between 0 and 1).
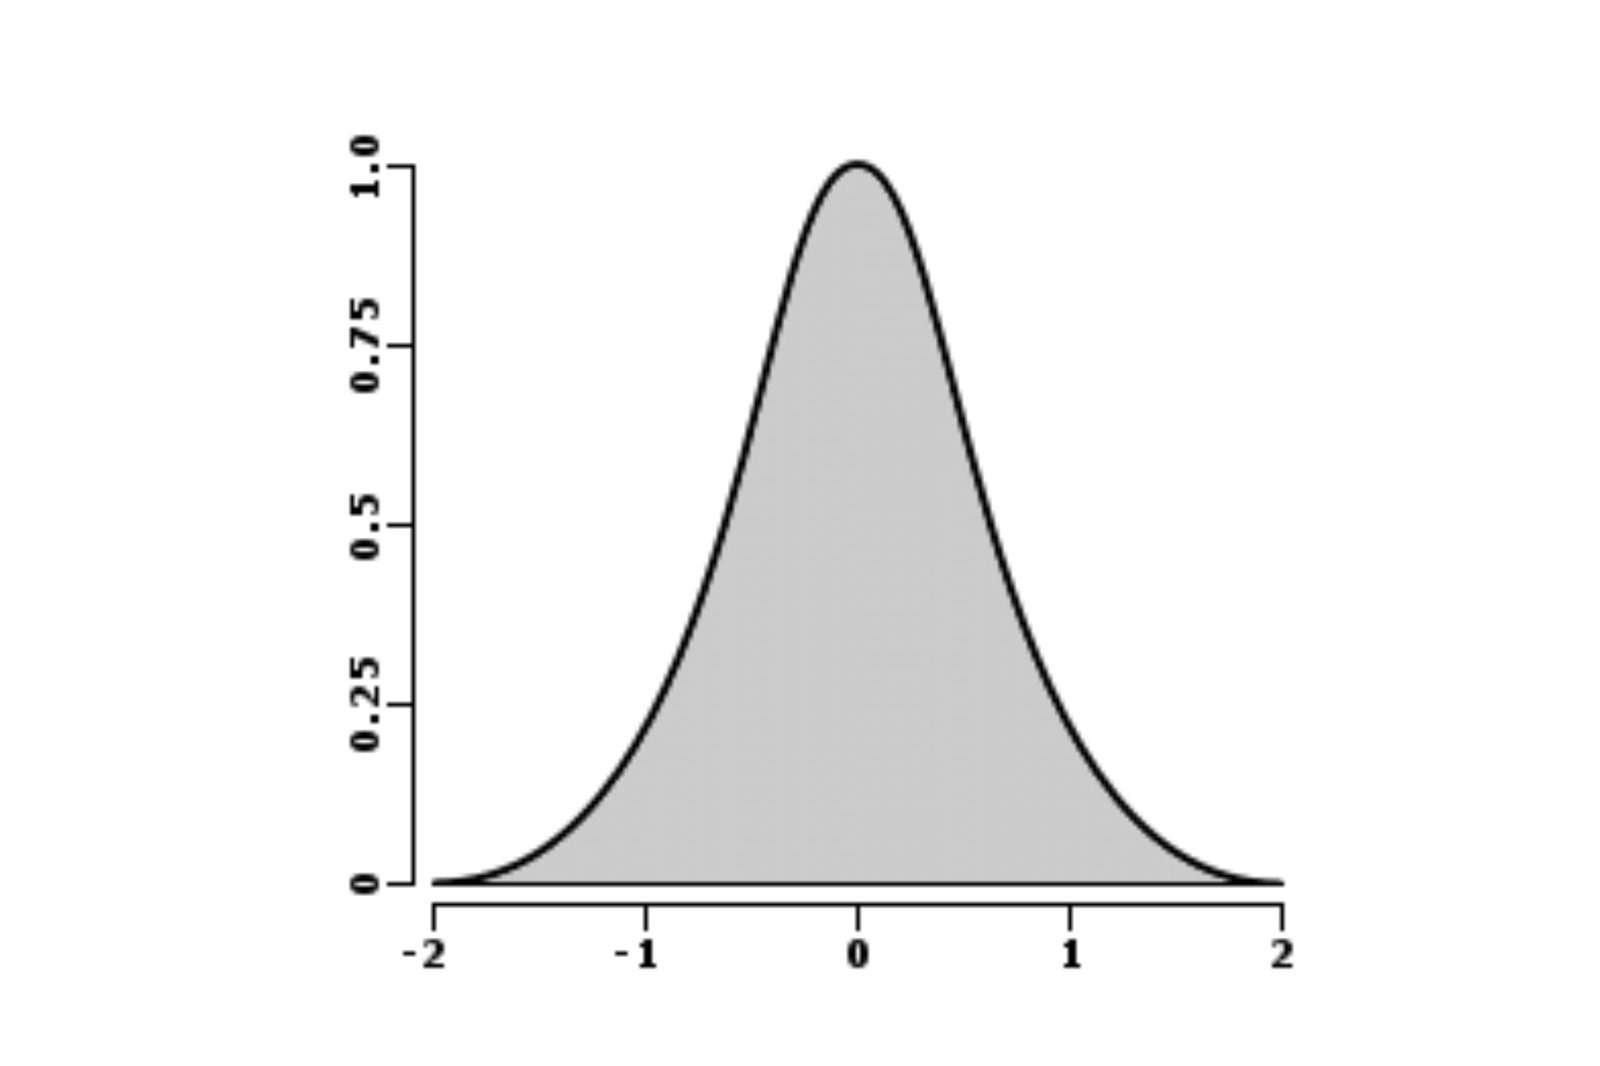
- Normal Distribution: Often referred to as the bell curve, it is characterized by a symmetric shape and is widely used in statistical analysis (e.g., heights or weights of a population).
- Exponential Distribution: Models the time between consecutive events in a Poisson process (e.g., the time between phone calls at a call center).
- Gamma Distribution: Generalizes the exponential distribution and is commonly used to model wait times, failure rates, and various other continuous positive variables.
- Beta Distribution: Represents probabilities of events occurring within a fixed interval and is often used as a prior distribution in Bayesian inference.
- Log-Normal Distribution: Describes variables that are the product of many small independent factors (e.g., stock prices or incomes).
Multivariate Distributions:

- Multinomial Distribution: Generalizes the binomial distribution to more than two outcomes (e.g., a dice roll with multiple possible outcomes).
- Multivariate Normal Distribution: Generalizes the normal distribution to multiple dimensions and is widely used in multivariate statistics and finance.
- Multivariate Poisson Distribution: Extends the Poisson distribution to multiple dimensions, often used in the analysis of rare events occurring simultaneously.
These are just a few examples of the many probability distributions available. Each distribution has its own unique properties, assumptions, and applications, allowing statisticians to model and analyze a wide range of phenomena.
Conclusion
Therefore, one of the most important topics in Data Science includes probability distribution. For the purpose of analysing data and acquiring crucial insights for business decision-making, probability distribution is an important part of the process. You can undertake different Data Science course offered by Pickl.AI thereby enhancing your skills and concepts in probability.
FAQs
What is a discrete probability distribution?
Discrete probability distribution refers to the occurrences of counts which have countable or finite outcomes. Binomial, Poisson and Bernoulli are the common discrete probability distributions.
Why do we use probability distributions in Data Science?
The use of probability distribution in Data Science is important for analysing data and preparing dataset for efficient training in algorithm. It allows skilled Data Analysts in recognising and comprehending patterns from large sets of data.
What are the applications of probability distributions in science?
Some of the practical applications of probability distribution are as follows:
- Calculating confidence intervals for parameters and calculating critical regions for testing hypothesis.
- In case of univariate data, it is often useful in determining a reasonable model of distribution for data.
- Distributional probability are often based on statistical intervals and hypothesis test.