The data domain continues to expand. Its impact across the different business niches is evident. However, what matters the most is the backend work. The techniques that help a Data Scientist and Analyst derive useful insight. One such key tool is statistics. Using statistical tools, Data Scientists can conduct market analysis on bulk numerical data. There are two different types of Statistical Analysis: Descriptive Statistics and Inferential Statistics. In this blog, we will explore the differences between Descriptive vs Inferential Statistics. Let’s get started!
What is Descriptive Statistics?
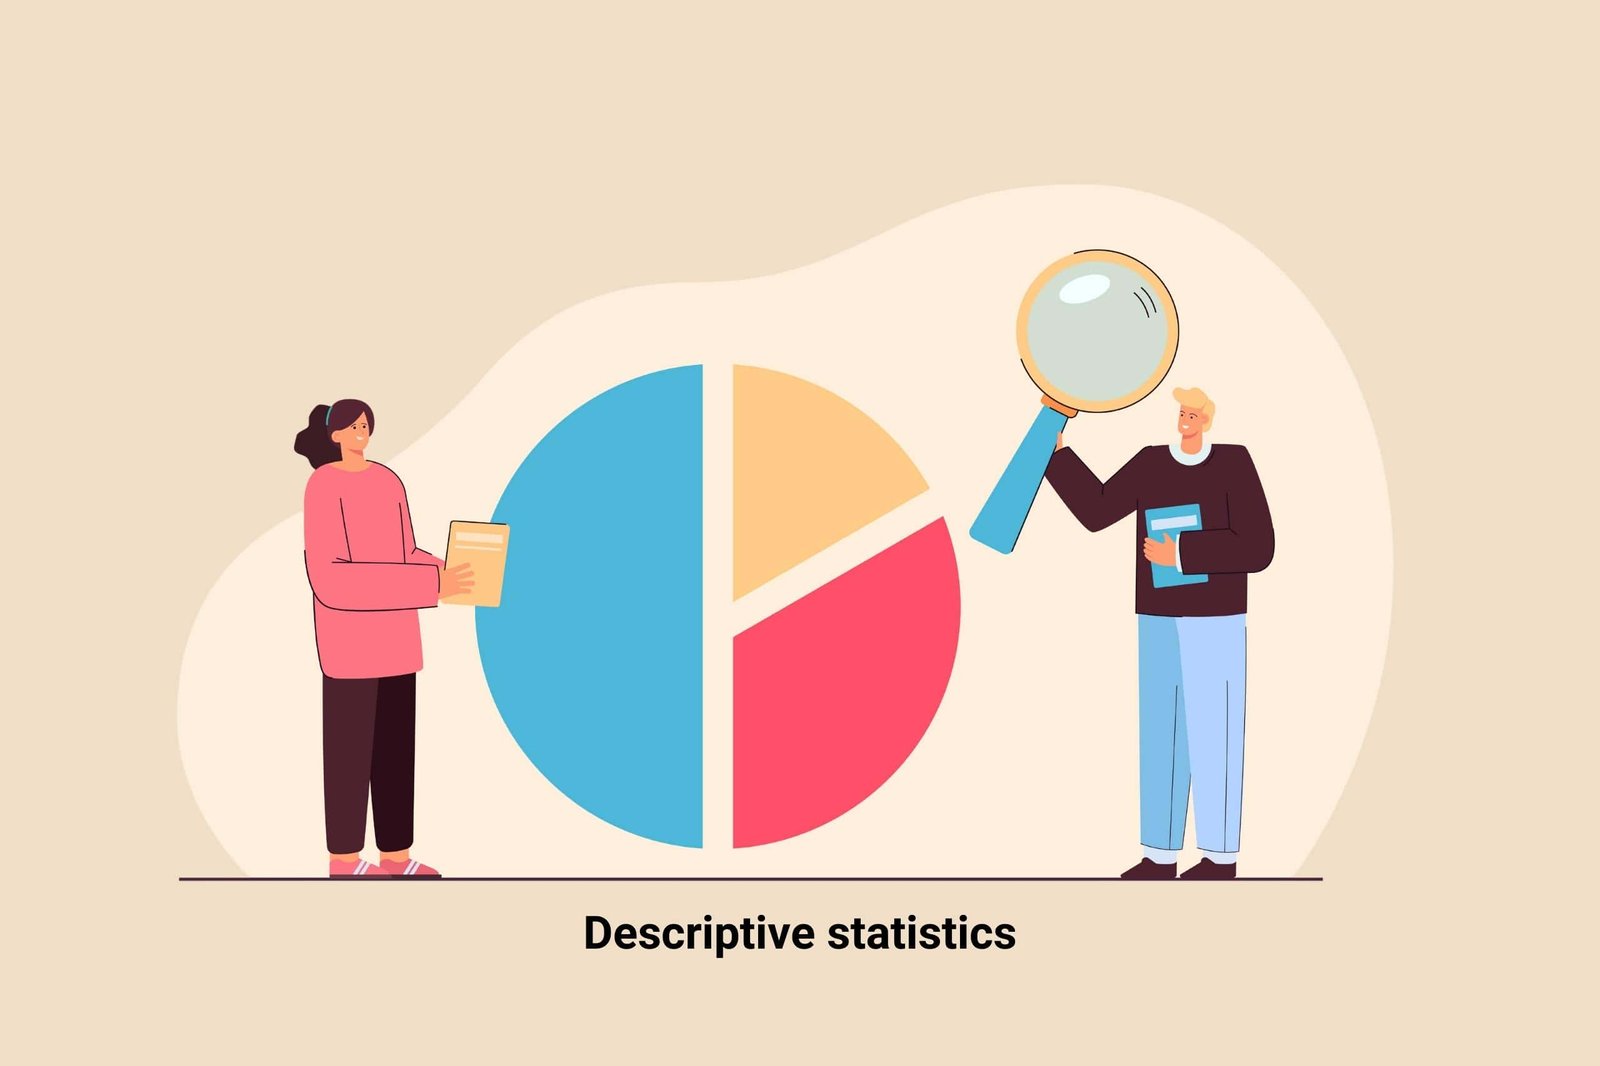
It is the branch of statistics that deals with data collection, analysis, and presentation. The key purpose of using this statistical method is to summarise and describe the critical features of a dataset, such as its central tendency, variability, distribution, and shape.
The main types of Descriptive Statistics are
- Frequency distribution
- Measures of central tendency
- Measures of variability
The measures of central tendency include the mean, median, and mode, which describe a dataset’s typical or main value. Measures of variability include the range, variance, and standard deviation, which represent how to spread out or variable the values in a dataset.
What is Inferential Statistics?
It is the branch of statistics that makes predictions or conclusions about a population while drawing a sample of data from the people. It involves using statistical methods to analyse and interpret data for making predictions and testing hypotheses. Moreover, Inferential Statistics relies on Probability Theory and Mathematical methods. Hence, these methods help quantify the uncertainty and variability in the data from which data samples were taken.
Some standard techniques used in inferential statistics include hypotheses testing, confidence intervals and regression analysis. The use of Inferential Statistics is widely popular in the field of science, business economics, social sciences and healthcare. It helps these industries to make decisions and draw practical conclusions based on empirical data. Moreover, the tool helps make informed decisions and assess the reliability and validity of the findings.

Types of Descriptive Statistics:
There are three types of Descriptive Statistics :
1. Frequency Distribution
It is a statistical tool used to analyse and organize the data such that it is easily comprehensible. It focuses on organizing and summarising the data using a table or graph that displays the frequency of each value or range of values within a dataset. Consequently, it often shows how the response is given for different qualitative and quantitative data types.
Bar charts, histograms, pie charts and line charts are popular ways of presenting frequency distribution. Accordingly, each entry within the graph or table shows how often each value or group of values appears in a Dataset.
For creating a frequency distribution, the data is first sorted into categories or intervals called bins representing the range of values for counting. The frequency from each bin is calculated, and the results are presented in a table.
2. Central Tendency
It is the type of descriptive statistics where the summary of the statistics is involved. It uses a single value reflecting the data distribution point. Central tendency locates the data distribution through various issues. Furthermore, it helps show the dataset’s average or most common responses. Measures of central tendency include the mean, median and mode.
3. Variability or Dispersion
Variability is a type of descriptive statistics that measures the extent to which the values in a dataset vary or spread out from each other. It summarises the amount of dispersion or diversity in a set of data. There are different types of measures of variability common in statistics, including range, variance, standard deviation, interquartile range and coefficient of variation.
Example of Descriptive Statistics:
Suppose we have a data set that contains the age of a group of people. Then we can use descriptive statistics to summarize and describe the data. We can calculate the mean, median, and mode to describe the typical age of the group. Similarly, we can also calculate the range and standard deviation to describe the spread of the data.
Types of Inferential Statistics:
1. Regression Analysis
With the help of regression models, finding the relationship between a set of independent and dependent variables is possible. The statistical model helps predict the dependent variable’s value, emphasising the independent variable’s values. With hypothesis testing, it is easy to determine whether the relationship observed from the sample data is valid per dataset.
2. Hypothesis Test
It is the method of inferential statistics which helps compare an entire population or analyse the relationships between variables using samples. Valid inferences are drawn from hypothesis testing or predictions using statistical tests.
3. Confidence Intervals
Inferential Statistics help in finding population estimate parameters for unknown values. Effectively, with the help of confidence interval, it is possible to observe the variability in a statistic for drawing an interval estimate for a parameter.
Example of Inferential Statistics:
Let’s assume we want to know whether the new weight loss is effective. For this, we can pick a sample of individuals participating in the program and measure their weight before and after it. We can then use inferential statistics to make inferences about the program’s effectiveness for the entire population. For this, we can use statistical tools like Hypothesis testing to compare the mean weight of the participant before and after the program. The null hypothesis would be that there is no significant difference in the weight before and after the program. The alternate hypothesis would be that there is a difference in weight.
We can use a statistical test, such as a t-test or z-test, to determine whether the difference in weight is statistically significant or simply due to chance.
Using inferential statistics, we can conclude the effectiveness of the weight-loss program and make predictions about the potential impact on the entire population.
Difference between Descriptive and Inferential Statistics
The differences between descriptive and Inferential Statistics lie within the process of the statistical reports. Following are the key differences that you will need to know about Descriptive and Inferential Statistics:
- Descriptive Statistics provides you with information on raw data based on the description or features. On the other hand, inferential statistics extract inferences on the sample population using data derived from the people.
- You can use Descriptive Statistics to describe a situation while using inferential statistics to explain the probability of an event’s occurrence.
- Significantly, Descriptive Statistics is useful to organise, analyse and presenting data in an understandable format. And so, Inferential Statistics helps compare data and make hypotheses and predictions.
- The data relevant to a particular sample or population is crucial in Descriptive Statistics and hence, is easy to explain. However, inferential statistics concludes a group of people.
- Moreover, Descriptive Statistics uses charts, graphs and tables to represent the data. On the other hand, probability methods are useful in the case of Inferential Statistics.
- Furthermore, a study is simple to perform using Descriptive Statistics rather than inferential statistics because you can establish a relationship between the entire population.
Conclusion
This brief discussion on the differences between Descriptive and Inferential Statistics would have given you an overview on both the methods and its key features. You must ensure that while you embark on a journey in Data Science, you must have complete clarity on the concepts and skills in this field. Statistics is crucial for a Data Science Career. You can develop these skills by joining Pickl.AI’s Data Analytics courses, where you learn about statistics and the different types of statistical methods along with the concepts of Analytics.