Botnet Detection at Scale — Lessons Learned From Clustering Billions of Web Attacks Into Botnets
Editor’s note: Ori Nakar is a speaker for ODSC Europe this June. Be sure to check out his talk, “Botnet detection at scale — Lesson learned from clustering billions of web attacks into botnets,” there!
A common problem in the cybersecurity industry is how to detect and track botnets from billions of daily attacks and millions of daily attacking IPs. Botnets are internet-connected devices that perform repetitive tasks, such as Distributed Denial of Service (DDoS). In many cases, these consumer devices are infected with malicious malware that is controlled by an external entity, often without the owner’s knowledge. Botnet detection and tracking are made harder by the fact that there’s constant turnover in these devices. Botnet detection allows for enhancing a website’s security and coming up with ways to mitigate its impact.
With millions of daily attacking IPs, botnet detection presents a scale problem, and therefore choosing the most relevant data is the most challenging task. The problem belongs to the cyber-security domain and is relevant to other domains as well. Read more to learn about the data flow, the challenges, and the way we get successful results.
Data Flow
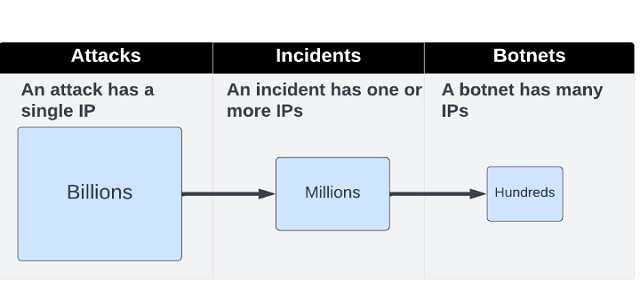
We would like to detect botnets from web incidents data. Incidents are clusters of web attacks, which are clustered online in a scope of a single website in a small time range. Here is the high-level flow:
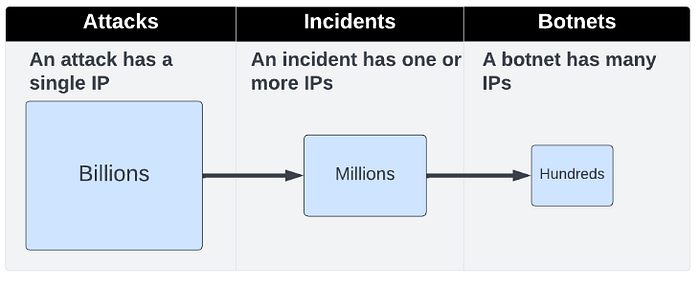
Figure 1: High-level flow
We wanted to leverage the connectivity between the IPs in the incident data to detect botnets. Here you can find the difference between incidents and botnets:
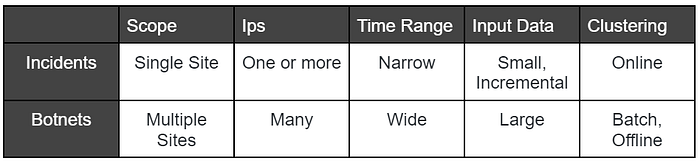
Figure 2: Incidents VS botnets
We have about 2.5 million incidents a day and about 5 million unique IPs a day. We wanted to look at a time window of the last few days to detect botnets. To cluster the data we have to calculate distances between IPs — The number of all possible IP pairs is very large, and we had to solve the scale problem.
Data Processing and Clustering
Our data is stored in a Data Lake and we used PrestoDB as a query engine. We tried to move as much weight as possible to the query engine to save on data movement, time, and cost. We use, and recommend, using a query engine in ML pipelines to save time and costs.
We queried the most relevant IPs and the most relevant IP pairs and made the entire process lighter compared to pure python code. Here you can find an example SQL query, with parameters we used in our experiments. The parameters used are the number of days back and the minimal number of IPs in an incident — both parameters have major scale effects:
SELECT id, ip, site_id
FROM incidents
WHERE day >= DATE_ADD('day', -{days_back}, CURRENT_DATE)
      AND CARDINALITY(ips) >= {min_ips_in_incident}
Figure 3: Incidents SQL with experiment parameters
The results of the first stage of the query are incident records. Each row has the following columns:
- id — Incident id
- ip — Attacking ip
- site_id — Attacked site
The filtering continues in the next steps of the pipeline. We filter IPs according to the number of incidents they participate in, to the number of attacked sites, and more. We also calculate and filter IP pairs. Here is an example in which we perform a self-join of the IP data, to find pairs of ips and filter them. The filter is done by the number of incidents both pair IPs are in, and the number of sites the pair has attacked:
SELECT l.ip AS ip_1, r.ip AS ip_2,
  COUNT() AS incidents,
  COUNT(DISTINCT site_id) AS sites
FROM ips AS l INNER JOIN ips r ON l.id = r.id AND l.ip < r.ip
GROUP BY 1, 2
HAVING COUNT() >= {min_pair_incidents}
  AND COUNT(DISTINCT site_id) >= {min_pair_sites}
Figure 3: IP pairs SQL with experiment parameters
In the example, we calculate pairs and features for each pair. In the example, we included the number of incidents and the number of attacked sites for each pair. Here are IP pairs query result example:
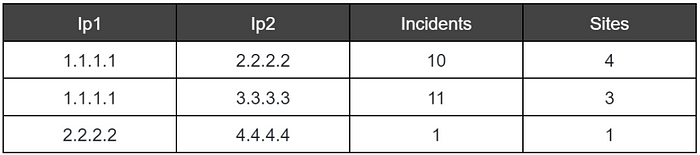
Figure 4: IP pairs results examples
It is possible to calculate more features and get more of the query engine. For example, it is possible to calculate attack types histograms for each IP, and then calculate the attack’s similarity between the two IPs using presto’s COSINE_SIMILIARY function. This is one of many functions the query engine supports.
Once we have the pairs and the features ready the next step is to calculate the distance between the ips in each of the pairs. A distance is a number between 0 and 1 which is calculated using a custom function based on a pair’s features. The distances are then added to a distance matrix which is sent to a clustering algorithm. The algorithm returns clusters — in our example the detected botnets.
Clusters Evaluation
The result clusters are then evaluated by joining them with the next day’s incident data. Here you can find the pipeline data flow, including size examples:
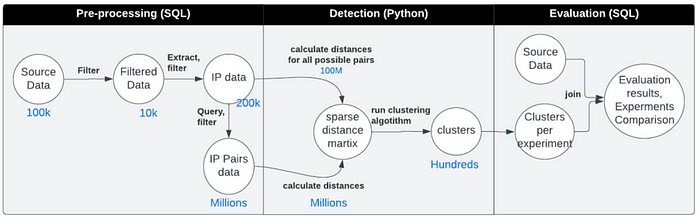
Figure 5: Pipeline flow including size examples
Here you can find an experiment result that includes clusters and their evaluation. Each cluster is scored using a custom function that looks at incidents reported after the cluster detection and checks if the botnet’s IPs continued to attack together. Here is an example of botnet scoring function logic:
- Find incidents with at least one IP from the botnet
- For each incident, compare the number of botnet IPs to the total number of IPs. A higher rate indicates a stronger connectivity between the botnet IPs
Here is an example of a scoring function results, together with some statistics on the evaluation data:
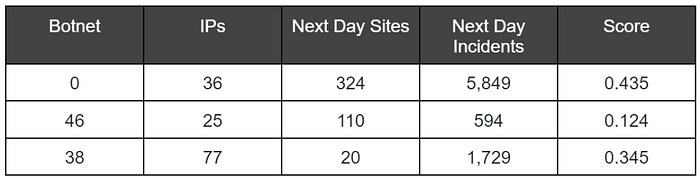
Figure 6: Clustering evaluation and evaluation result
The evaluation function can look at more information like the attack tools and attack payload. It should return a measurable value for comparison between experiments.
We are also using visualization tools to look at experiment results and validate them. Here you can see the attack types distribution for experiment results:
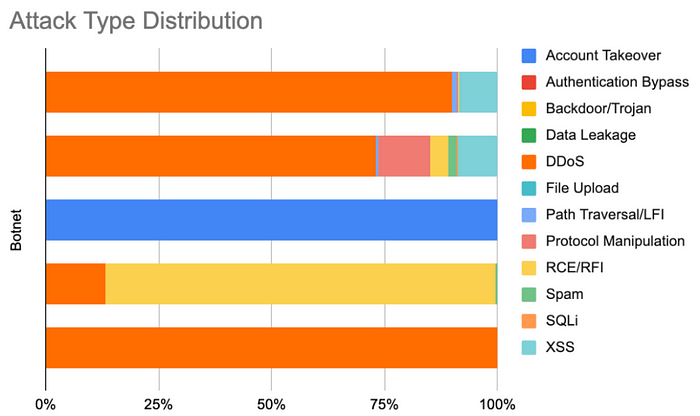
Figure 7: Results visualization
We use visualization to look at attack types, attack clients, top payloads, and more. It helps understand the data and fine-tune experiments. It also helps us choose the more interesting botnets for drill downs.
Experiments
The pipeline is set and we have initial clusters and scores. It is now time to run experiments to get better results. We will need to score our experiments based on our botnet’s scores — we can use a custom function like for example the average of the botnets scores.
Each change to an SQL parameter can be critical to the results, to the query runtime, and to the pipeline’s required resources. Changes to the distance function, clustering algorithm, and hyperparameters have to be done to fine-tune the results and to work with technical limits.
Here are some experiment results examples, including information like SQL parameters, clustering algorithm, hyperparameters, and consumed resources:
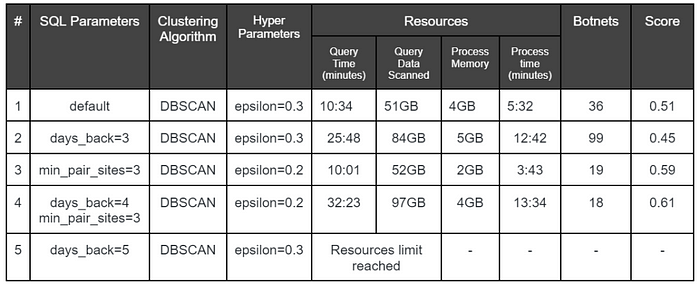
Figure 8: Experiments comparison
Takeaway
Using a query engine allowed us to run many experiments and get better results fast. The data stayed in the query engine, which made our experiments cost-effective. The query engine can process billions of records in minutes and we used it as much as possible — both in the pre-processing phase and in the evaluation phase. Our recommendation is to keep in mind the query engine as part of your ML pipelines.
Tuning was performed to get to an acceptable score, acceptable runtime, and using acceptable resources — it was done by running experiments and comparing them. In our example, we used unsupervised learning and a custom scoring function calculated by the query engine to fine-tune the results. Such scoring function can be added to any ML pipeline, including supervised learning in which you can add it as another metric to common metrics like AUC or accuracy.
About the author/ODSC Europe speaker on botnet detection:

Ori Nakar is a principal cyber-security researcher, a data engineer, and a data scientist at Imperva Threat Research group. Ori has many years of experience as a software engineer and engineering manager, focused on cloud technologies and big data infrastructure. Ori also has an AWS Data Analytics certification. In the Threat Research group, Ori is responsible for the data infrastructure and is involved in analytics projects, machine learning, and innovation projects.
Originally posted on OpenDataScience.com
Read more data science articles on OpenDataScience.com, including tutorials and guides from beginner to advanced levels! Subscribe to our weekly newsletter here and receive the latest news every Thursday. You can also get data science training on-demand wherever you are with our Ai+ Training platform. Subscribe to our fast-growing Medium Publication too, the ODSC Journal, and inquire about becoming a writer.
