Introduction
Machine Learning is a subfield of artificial intelligence that focuses on the development of algorithms and models that allow computers to learn and make predictions or decisions based on data, without being explicitly programmed. Supervised learning, unsupervised learning and reinforcement learning are three different kinds of approaches present in machine learning. Supervised learning is a type of machine learning in which an algorithm is trained on a labeled dataset, which means the input data has a corresponding output or response. The algorithm learns to map the input data to the correct output based on the provided examples. Unsupervised learning is a type of machine learning in which an algorithm is trained on an unlabeled dataset, which means there is no pre-defined output or response for the input data. The algorithm learns to find patterns or structure in the data by clustering similar data points together. Reinforcement learning is a type of machine learning in which an agent learns to make decisions by interacting with an environment. The agent receives feedback in the form of rewards or punishments based on its actions, and it learns to take actions that maximize its rewards over time. It’s like a trial-and-error method of learning, where the agent explores different options and learns from its mistakes to improve its performance.
What is Clustering?
Clustering is an unsupervised machine learning technique that is used to group similar entities. Those groups are referred to as clusters. In simpler words, these clusters are groups of like objects that differ from the objects in other clusters. The clusters are formed by finding some similar patterns in the unlabelled dataset such as shape, size, color, behavior, etc., and divides them as per the presence and absence of those similar patterns.
Clustering is somewhere similar to the classification algorithm, but the difference is the type of dataset that we are using. In classification, we work with the labeled data set, whereas in clustering, we work with the unlabelled dataset. Clustering technique is commonly used for statistical analysis.
Let us try to understand the clustering technique with a real world example.
A supermarket may use clustering to group together similar products in the store. For instance, all the canned goods may be placed in one section, all the dairy products in another section, and all the bakery products in a third section. This can help customers easily find the products they’re looking for and navigate the store more efficiently.
Within each section, further clustering may be used to organize the products. For instance, in the canned goods section, products may be grouped together by type, such as vegetables, soups, and sauces. In the dairy section, products may be grouped together by brand or by type, such as milk, cheese, and yogurt.
Read Blog: Classification vs. Clustering
Clustering Methods:
Now let us look into the various methods of clustering that are used to group the similar entities. Below are the main clustering methods used in machine learning.
-
Partitioning Clustering Method
It is used to make partitions on the data in order to form clusters. If “n” partitions are done on “p” objects of the database then each partition is represented by a cluster and n < p. The two conditions which need to be satisfied with this Partitioning Clustering Method are:
- One objective should only belong to only one group.
- There should be no group without even a single purpose.
In the partitioning method, there is one technique called iterative relocation, which means the object will be moved from one group to another to improve the partitioning
-
Density based Clustering Method
Density-based clustering is a type of clustering method that identifies clusters based on areas of higher density in the data space. The main idea behind density-based clustering is that points that are close together in a high-density region should belong to the same cluster, while points that are far away from such regions are considered as noise.
-
Distribution Model-based Clustering Method
In the model-based method, all the clusters are hypothesized in order to find the data which is best suited for the model. The clustering of the density function is used to locate the clusters for a given model. It reflects the spatial distribution of data points and also provides a way to automatically determine the number of clusters based on standard statistics, taking outlier or noise into account. Therefore it yields robust clustering methods.
-
Hierarchical Clustering Method
Hierarchical clustering is a clustering method that seeks to build a hierarchy of clusters. It is an unsupervised learning algorithm that does not require predefined clusters or labels. The algorithm starts by considering each point as a separate cluster and then iteratively merges the closest pairs of clusters until all the points are in a single cluster.
There are two main types of hierarchical clustering: agglomerative and divisive.
1. Agglomerative Hierarchical Clustering:
Agglomerative hierarchical clustering is the most common type of hierarchical clustering. It starts with each point as a separate cluster and then iteratively merges the closest pairs of clusters until all the points are in a single cluster. The algorithm can use different methods to determine the distance between clusters, such as single linkage, complete linkage, or average linkage.
- Single linkage: The distance between two clusters is defined as the minimum distance between any two points in the two clusters.
- Complete linkage: The distance between two clusters is defined as the maximum distance between any two points in the two clusters.
- Average linkage: The distance between two clusters is defined as the average distance between all pairs of points in the two clusters.
2. Divisive Hierarchical Clustering:
Divisive hierarchical clustering, on the other hand, starts with all the points in a single cluster and then iteratively divides the clusters until each point is in its own cluster. This approach is less common and more computationally intensive than agglomerative clustering.
Hierarchical clustering has many applications, such as identifying groups of customers based on their purchasing behavior, clustering genes based on their expression levels, or clustering images based on their similarity. It can also be used for visualization, as the hierarchical structure of the clusters can be represented as a dendrogram.
Now, let us have a look at the various clustering algorithms in machine learning that are widely used.
Clustering Algorithms & Their Implementation:
Clustering algorithms are used in exploring data, anomaly detection, finding outliers, or detecting patterns in the data. These are a type of unsupervised learning algorithm that groups similar data points together. The main goal of clustering is to partition the data into groups or clusters, such that the data points in each group are more similar to each other than to the data points in other groups.
There are many different clustering algorithms, each with its own strengths and weaknesses. Here are some of the most popular clustering algorithms:
1. K MEANS CLUSTERING ALGORITHM
K-means clustering is a popular clustering algorithm that aims to partition a given dataset into K clusters, where K is a predefined number of clusters. It is an unsupervised learning algorithm that assigns each data point to one of the K clusters based on the proximity of the data point to the centroid of the cluster.
Here’s how the K-means algorithm works:
- Initialize K centroids randomly from the data points or by any other method.
- Assign each data point to the closest centroid based on the Euclidean distance.
- Calculate the mean of each cluster and set it as the new centroid.
- Repeat steps 2 and 3 until the centroids no longer change or a maximum number of iterations is reached.
- The K-means algorithm converges to a local minimum, so it can be sensitive to the initial placement of centroids. Therefore, it is common to run the algorithm multiple times with different initial centroids and choose the solution with the lowest within-cluster sum of squares.
Advantages:
- It is fast, easy to implement, and works well on large datasets.
- It is also suitable for cases where the data is evenly distributed in the feature space.
Disadvantages:
- It requires the number of clusters to be predefined, which can be difficult to determine in practice.
- It also assumes that clusters are spherical and equally sized, which may not be the case in real-world scenarios.
- It is sensitive to outliers, which can affect the placement of the centroids and the clustering results.
Now, let us implement K Means Clustering using Python.
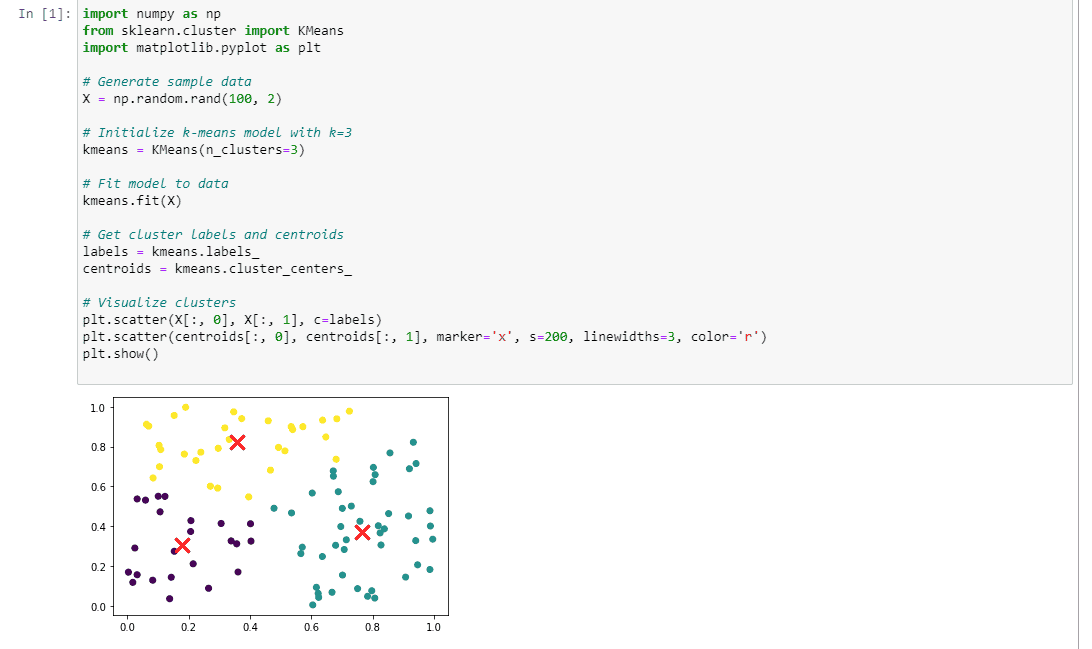
In the above code, we visualize the clusters using a scatter plot, where each data point is colored according to its cluster assignment, and the centroids are marked with a red ‘x’ marker.
2. DBSCAN CLUSTERING ALGORITHM
DBSCAN (Density-Based Spatial Clustering of Applications with Noise) is a density-based clustering algorithm that groups together data points that are close to each other in high-density regions and separates out low-density regions as noise. Here are the steps involved in the DBSCAN algorithm:
- Determine the distance metric: The first step is to determine the distance metric that will be used to measure the distance between data points. The most commonly used distance metric is the Euclidean distance.
- Define the neighborhood of a point: The next step is to define the neighborhood of a point based on a specified radius (epsilon) around it. A point is said to be a neighbor of another point if it falls within the specified radius of that point.
- Identify core points: A point is considered a core point if it has at least a minimum number of neighbors within its epsilon neighborhood.
- Form clusters: DBSCAN starts by picking a random core point, and then forms a cluster by adding all of its neighbors within the epsilon radius. It continues to add neighbors to the cluster recursively, until there are no more points that are within the epsilon neighborhood of the existing cluster.
- Identify noise points: Any points that are not within the epsilon neighborhood of any core point are considered noise points and are discarded.
The key parameters in DBSCAN are epsilon and minimum points. Epsilon controls the size of the neighborhood around each point, and minimum points determine the minimum number of points that must be within the neighborhood for a point to be considered a core point. These parameters can greatly affect the results of the clustering and should be chosen carefully based on the characteristics of the dataset.
DBSCAN is a popular clustering algorithm because it can automatically discover clusters of arbitrary shapes and sizes. It is also robust to noise and can handle datasets with non-uniform densities.
Below is the sample implementation of the DBSCAN clustering algorithm using python.

3. BIRCH CLUSTERING ALGORITHM
BIRCH (Balanced Iterative Reducing and Clustering using Hierarchies) is a hierarchical clustering algorithm that is designed to handle large datasets efficiently. It was proposed by Tian Zhang, Raghu Ramakrishnan, and Miron Livny in 1996. BIRCH algorithm consists of two main phases. They are:
- Clustering Feature Extraction (CFE) Phase: In this phase, BIRCH builds a hierarchical clustering feature tree (CF-tree) by recursively partitioning the dataset into smaller clusters. Each cluster is represented by a cluster feature, which is a summary of the data points in that cluster. The CF-tree is a balanced tree that allows for efficient clustering of new data points.
- Clustering Phase: In this phase, BIRCH performs clustering on the CF-tree using a hierarchical clustering algorithm. The algorithm starts with the root of the CF-tree and recursively moves down the tree, merging clusters as it goes. The final result is a hierarchical clustering of the original dataset.
Advantages:
- It is well-suited for large datasets, as it can handle millions of data points efficiently.
- It uses a memory-efficient data structure (CF-tree) to represent the clusters, which allows for fast clustering of new data points.
- It can handle datasets with noise and outliers, as it uses a threshold-based splitting criterion to determine when to split clusters.
- It is a hierarchical algorithm, which means that it can produce a hierarchy of clusters that can be explored at different levels of granularity.
Disadvantages:
- It is sensitive to the choice of the threshold parameter, which determines when to split clusters. The threshold value needs to be carefully chosen based on the characteristics of the dataset.
- It may not work well for datasets with complex and irregular shapes, as it uses a simple distance-based clustering criterion.
- It is not suitable for online or real-time clustering, as it requires the entire dataset to be loaded into memory.
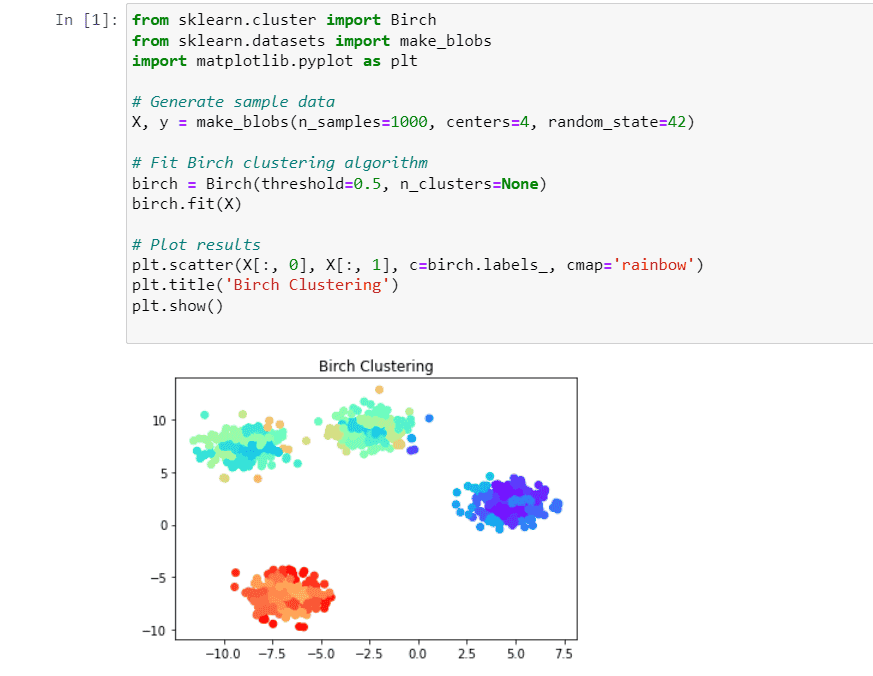
Below is the implementation of BIRCH Clustering algorithm using python.
4. GAUSSIAN MIXTURE MODEL CLUSTERING ALGORITHM
Gaussian Mixture Model (GMM) is a probabilistic clustering algorithm that models the underlying distribution of the data using a mixture of Gaussian distributions. It assumes that the data points are generated from a mixture of k Gaussian distributions, each characterized by a mean and a covariance matrix.
The GMM algorithm can be summarized in the following steps:
- Initialization: The algorithm starts by randomly initializing the means and covariance matrices of the k Gaussian distributions.
- E-step (Expectation): In this step, the algorithm assigns each data point to one of the k Gaussian distributions based on the probability density function (PDF) of each distribution. This is done using the Bayes’ rule, which calculates the posterior probability of each data point belonging to each Gaussian distribution.
- M-step (Maximization): In this step, the algorithm updates the mean and covariance matrix of each Gaussian distribution based on the assigned data points. This is done by maximizing the log-likelihood function, which measures the probability of the data points given the current parameters.
- Repeat: Steps 2 and 3 are repeated until the parameters converge to a stable value or a stopping criterion is met.
The output of the GMM algorithm is a set of k Gaussian distributions, each with its own mean and covariance matrix. The algorithm also provides the probability of each data point belonging to each of the k clusters.
Advantages:
- It can handle datasets with complex and irregular shapes, as it models the underlying distribution of the data using a mixture of Gaussians.
- It provides a probabilistic framework for clustering, which allows for uncertainty quantification and model selection.
- It can handle datasets with missing or incomplete data, as it uses maximum likelihood estimation to estimate the parameters of the Gaussian distributions.
Disadvantages:
- It can be sensitive to the initialization of the means and covariance matrices, which can lead to local optima.
- It can be computationally expensive for large datasets and high-dimensional feature spaces.
- It assumes that the data points are generated from a mixture of k Gaussian distributions, which may not always be true in practice.
Let us look into the python implementation of Gaussian Mixture Model Clustering algorithm.

Applications:
Clustering has many practical applications in various fields. Some of the common applications of clustering include:
- Customer Segmentation: Clustering is commonly used in marketing to segment customers into groups based on their purchasing behavior, demographics, and other characteristics. This can help businesses tailor their marketing strategies and product offerings to specific customer groups.
- Image Segmentation: Clustering can be used in image processing to segment images into different regions based on their color, texture, or other features. This can be useful for object recognition, image retrieval, and other applications.
- Anomaly Detection: Clustering can be used to detect anomalies in data by identifying clusters that are significantly different from the majority of the data points. This can be useful in fraud detection, network intrusion detection, and other applications.
- Document Clustering: Clustering can be used in natural language processing to group similar documents together based on their content. This can be useful for text classification, topic modeling, and other applications.
- Recommendation Systems: Clustering can be used in recommendation systems to group users or items based on their similarities, and then make recommendations based on the preferences of similar users or items.
- Bioinformatics: Clustering can be used in bioinformatics to group genes or proteins based on their expression profiles or sequence similarities. This can help identify gene functions, predict protein structures, and other applications.
- Time Series Clustering: Clustering can be used to group time series data into similar patterns. This can be useful in predicting stock prices, weather forecasting, and other applications.
Overall, clustering is a powerful tool for discovering patterns and relationships in data, and has a wide range of practical applications in many fields.
Conclusion
Hence, Clustering is an essential technique for understanding the structure of complex datasets, and its wide range of applications make it a valuable tool for many fields. By using clustering algorithms effectively, we can gain deeper insights into our data and make better decisions based on the patterns and relationships we uncover.


![Basic Tutorial to TensorFlow in Machine Learning [With Example]](https://www.pickl.ai/blog/wp-content/uploads/2023/07/TensorFlow-in-Machine-Learning-150x150.jpg)