Embed charts or tables in the IBM watsonx Assistant
Authors: ,
This story was originally published at developer.ibm.com.
Nowadays organisations focus on giving a better experience to their customer via online services. They are now using AI to automate some of the manual tasks and to do that a chatbot is an important tool to have on their online platform.
A lot of enterprise platforms are using IBM’s chatbot called watsonx Assistant which provides AI and LLM capabilities. We have seen that it is easy to play with texts in the assistant chatbot but it is also possible to embed images, charts, tables, etc in the watsonx Assistant. In this article, we will explore the solution to do the same.

Step 1: Register a custom response listener in the web app
Here first of all we need to register a listener which will be triggered when a particular event is fired from the assistant. In our case, this event will be triggered whenever the user asks a question.
Please find below the code for the JavaScript file of a webpage:
var g_wa_instance;
window.watsonAssistantChatOptions = {
  integrationID: "" // your assistant integrationId,
  region: "" // your assistant region,
  serviceInstanceID: "" // your assistant serviceInstanceID,
  showRestartButton: true,
  onLoad: function (instance) {
    g_wa_instance = instance;
     instance.on({
      type: "customResponse",
      handler: (event, instance) => {
        if (
          event.data.message.user_defined &&
          event.data.message.user_defined.user_defined_type === "embed-multimedia"
        ) {
          embedChartOrTableHandler(event);
        }
      },
    });
    instance.render();
  }
Step 2: Handler to call an API and embed chart/table in the web chat
We will implement a handler that calls an API /getAnswer to fetch the chart/table in the form of HTML. The response will be embedded in the assistant window.
async function embedChartOrTableHandler(e) {
  const { element, message } = e.data;
  const query = message.user_defined.user_query

  const SERVER = "" // backend server URL
  fetch(SERVER + "/getAnswer", {
    method: "POST",
    headers: {
      "Content-Type": "application/json",
    },
    body: JSON.stringify({ question: query }),
  }).then(
    async (res) => {
      const response = await res.json();
      if (response.data) {
        const { data } = response;
        element.innerHTML = data
        messageChatbot("step successful", true);
        return;
      }
      messageChatbot("Some error occured.", true);
    },
    (err) => {
      messageChatbot("Unable to get answer based on your query.", true);
    }
  );
}
Step 3: Endpoint implementation to generate a chart/table
Create a POST endpoint /getAnswer & add your custom logic. To prepare a chart, get the data in the form of array of labels and values. To prepare a table, get the data in the form of array of headers and rows (array of arrays).
To generate a chart or table, individual functions are shown below.
Node.js server endpoint:
// endpoint to return chart or table
app.post("/getAnswer", async (req, res) => {
  try {

        // used as a return values
        let type = "";
        let data = "";

        if (<send-chart-as-output>) {
          const labels = ["a", "b"]; // lables to show in chart
          const values = [15, 34]; // values on which chart will be prepared
          const chartString = await generateChart(labels, values);
          const imgTag = `<img class="WACImage__Image WACImage__Image--loaded" src="${chartString}" alt="" style="display: block;"/>`;
          type = "img";
          data = imgTag;
        }
        else if (<send-table-as-output>) {
          const headers = ["h1", "h2"]; // table headers
          const rows = [["hello", "world"], ["hi", "there"]]; // rows to show in the table
          const table = generateTable(headers, rows);
          type = "table";
          data = table;
        }
        else {
          type = "text";
          data = "<text-output>"
        }

        res.json({
          type: type !== "" ? type : "text",
          data: data !== "" ? data : "No results found",
        });
        return;

  } catch (err) {
    res.send({
      type: "text",
      data: "Unable to get answer, please retry with another query."
    });
  }
});
Function to generate a chart:
generateChart function takes labels and values & returns a data string of the chart.
// We will use npm package "chartjs-node-canvas" to generate charts.
const { ChartJSNodeCanvas } = require("chartjs-node-canvas");

async function generateChart(labels, values) {

  // setting properties for chart
  const width = 450;
  const height = 300;

  const chartJSNodeCanvas = new ChartJSNodeCanvas({
    width,
    height
  });
  const cfg = {
    type: "line", // chart type like bar, line, etc.
    data: {
      datasets: [
        {
          data: values
        }
      ],
      labels: labels,
    }
  };
  return await chartJSNodeCanvas.renderToDataURL(cfg);
}
Function to generate Table:
generateTable function takes headers and rows & returns an HTML string of the table.
function generateTable(headers, rows) {
let table = "<table><tr>";
headers.map((header) => {
table += `<td style='border: 1px solid black; padding: 5px'><strong>${header}</strong></td>`;
});
table += "</tr>";
rows.map((row) => {
table += "<tr>";
row.map((item) => {
table += `<td style='border: 1px solid black; padding: 5px'>${item}</td>`;
});
table += "</tr>";
});
table += "</table>";
return table;
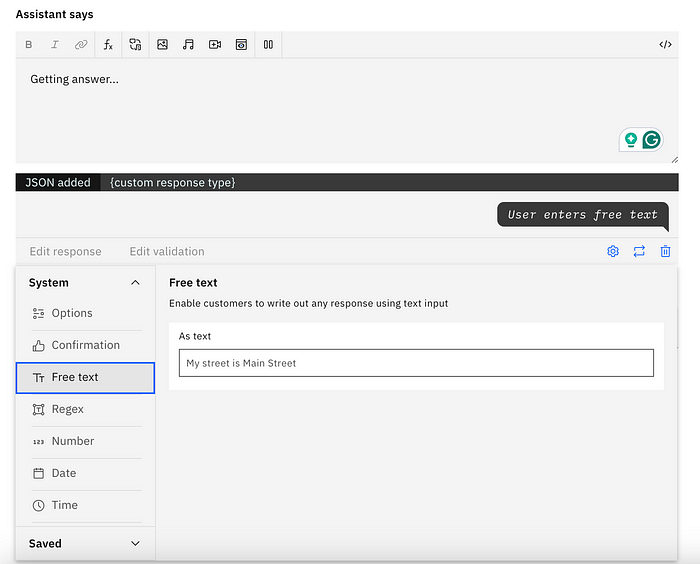
}Step 4: Create a step inside an action in watsonx Assistant
Finally, create an action in watsonx Assistant with a step to trigger a custom event named embed-multimedia. This event will be listened to in Step 1 of this article.
In a watsonx Assistant action step, switch to the JSON editor first. Then add the following JSON and save:
{
  "generic": [
    {
      "values": [
        {
          "text_expression": {
            "concat": [
              {
                "scalar": "Getting answer..."
              }
            ]
          }
        }
      ],
      "response_type": "text",
      "selection_policy": "sequential"
    },
    {
      "user_defined": {
        "user_query": "<? input.text ?>",
        "user_defined_type": "embed-multimedia"
      },
      "response_type": "user_defined",
      "repeat_on_reprompt": false
    }
  ]
}
Now, set the customer response type to "Free text" to enable conditional flow based on the response.
That’s it. Run the application and see the results in your watsonx Assistant webchat window.
Conclusion:
Explore the use case demo built using this feature on the dsce.ibm.com platform. Explore watsonx Assistant demo site for more complex use cases.

