Unlocking the Power of Hypothesis Testing: Formulas and Widely Used Tests

Introduction
Hypothesis testing is a fundamental statistical technique used to make informed decisions and draw conclusions about populations based on sample data. It allows researchers to assess whether an observed effect is statistically significant or due to chance. In this article, we will explore the key concepts of hypothesis testing, delve into the formulas involved, and examine some commonly used tests.
Understanding Hypothesis Testing
Hypothesis testing involves two competing hypotheses: the null hypothesis (H0) and the alternative hypothesis (Ha). The null hypothesis represents the status quo or the absence of an effect, while the alternative hypothesis proposes a specific claim or research hypothesis.
The Hypothesis Testing Process
1. Formulate the hypotheses:
- Null Hypothesis (H0): No significant difference or effect exists.
- Alternative Hypothesis (Ha): A specific difference or effect exists.
2. Set the significance level (α):
- The significance level, denoted by α, is the probability of rejecting the null hypothesis when it is true.
- Commonly used significance levels include 0.05 and 0.01.
3. Collect and analyze the data:
- Gather a representative sample and collect relevant data.
- Compute the test statistic, which measures the degree of evidence against the null hypothesis.
4. Determine the critical region and critical value:
- The critical region represents the extreme values of the test statistic that would lead to rejecting the null hypothesis.
- The critical value is the dividing point that separates the critical region from the non-critical region.
5. Compare the test statistic and critical value:
- If the test statistic falls within the critical region, the null hypothesis is rejected.
- If the test statistic falls within the non-critical region, the null hypothesis is not rejected.

Commonly Used Tests
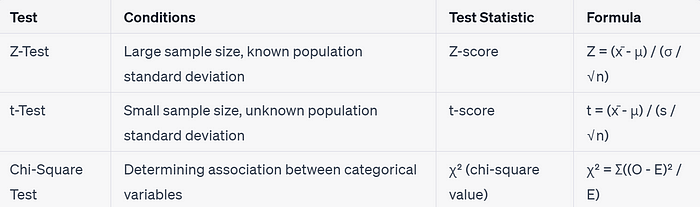
- Z-Test: The Z-test is used when the sample size is large, and the population standard deviation is known. The test statistic (Z-score) is calculated using the formula: Z = (x̄ — μ) / (σ / √n) where x̄ is the sample mean, μ is the population mean, σ is the population standard deviation, and n is the sample size.
- t-Test: The t-test is used when the population standard deviation is unknown, and the sample size is small. The test statistic (t-score) is calculated using the formula: t = (x̄ — μ) / (s / √n) where x̄ is the sample mean, μ is the population mean, s is the sample standard deviation, and n is the sample size.
- Chi-Square Test: The chi-square test is used to determine if there is a significant association between categorical variables. The test statistic (χ²) is calculated using the formula: χ² = Σ((O — E)² / E) where O is the observed frequency, and E is the expected frequency.
Here is a table summarizing the commonly used hypothesis testing methods along with their respective formulas:
These tests provide researchers with powerful tools to analyze data and draw conclusions about population parameters. By applying the appropriate test based on the given conditions, researchers can make informed decisions and contribute to evidence-based knowledge in their respective fields.
Conclusion
Hypothesis testing is a powerful tool for researchers to evaluate the significance of their findings and make informed decisions. By understanding the key concepts and utilizing appropriate tests, researchers can draw reliable conclusions from their data. In this article, we discussed the hypothesis testing process, including formulating hypotheses, setting significance levels, analyzing data, and determining critical regions. Additionally, we explored three commonly used tests: the Z-test, t-test, and chi-square test, along with their respective formulas. By employing these techniques correctly, researchers can make confident and evidence-based conclusions in their studies.